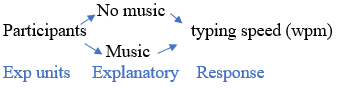
Student researchers (Coutin & Heffler, 2021) wanted to know whether listening to up-tempo music causes college students to tend to type faster. To collect their data (number of words typed correctly in one minute), the students planned to use the 60-second Easy-Text typing test (TypingTest.com).
They recruited 34 college students from groups they were associated with on campus (e.g., athletic teams, musical groups). For the up-tempo music they selected Overture to Candide performed by the London Symphony Orchestra.
Let \(\mu_{nomusic}\) represent the population mean typing speed without the music and \(\mu_{music}\) the population mean typing speed with the music.
\begin{gather*}
H_0: \mu_{nomusic} - \mu_{music} = 0\\
\text{ (there is no difference in the mean typing speed with and without the music)}\\
H_a: \mu_{nomusic} - \mu_{music} \lt 0 \\
\text{ (the average typing speed is larger when the up-tempo music is playing)}
\end{gather*}
The explanatory variable (whether or not the music is playing) is categorical and the response variable (typing speed measured in words per minute) is quantitative.
You would want to make sure the conditions for each participant are as identical as possible (e.g., no distractions, same level of motivation). You would want to make sure that the timing starts at the same time for everyone, that everyone listens to the same music at the same volume etc.
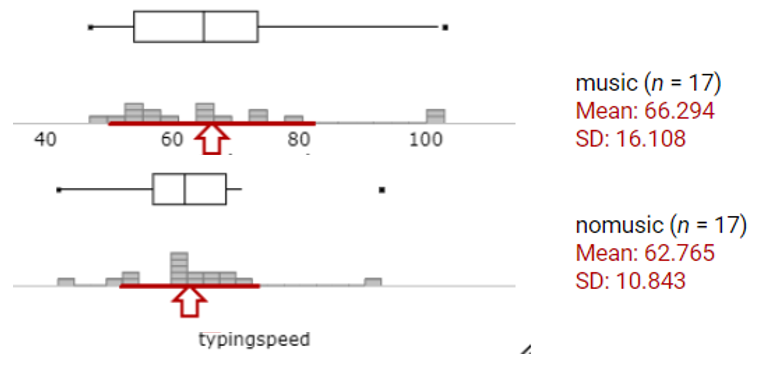
Do you see much of a difference between the two distributions? What is the observed difference in the sample means? Do you think this difference in sample means will be statistically significant? Explain.
There is very little difference between the distributions. The means are only about 3.5 words per minute apart and there is substantial variation with standard deviations of 10.8 and 16.1 words per minute. With such much overlap between the two distributions and relatively small sample sizes, it is unlikely that this difference will be considered statistically significant.
The sample sizes are both below 20 and we do have a few outliers. Apart from the outliers, the shapes are somewhat symmetric and similar to each other. This is a pretty borderline case and we may want to explore additional approaches as well.
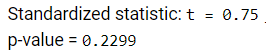
The one-sided p-value from a two-sample t-test is 0.2299, failing to provide convincing evidence that the average typing speed is faster with (this) music than the average typing speed without music. But maybe there is a genuine difference and our sample sizes are just too small to detect it.
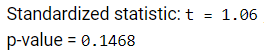
Suppose everything else remained the same but the sample sizes had been 34 in each group. How would that impact the p-value? By a lot or by a little? Would the difference now be statistically significant?
In this case, we would still fail to reject the null hypothesis. This is because \(SD(\bar{x}_1 - \bar{x}_2) = \sqrt{\frac{10.8^2}{17} + \frac{16.1^2}{17}} \approx 4.71\) is still fairly large, compared to \(SD(\bar{x}_1 - \bar{x}_2) = \sqrt{\frac{10.8^2}{34} + \frac{16.1^2}{34}} \approx 3.33\text{.}\)
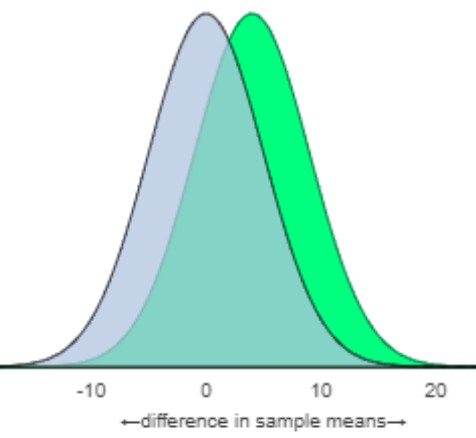
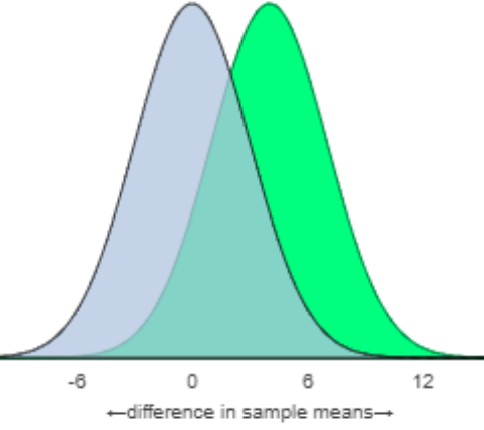
The images below show the null distribution (in blue) for the difference in sample means, and the alternative distribution (in green) for the difference in sample means when the actual difference in population means is 4 wpm. We see quite a bit of overlap in the two distributions so the probability of rejecting the null hypothesis is small.
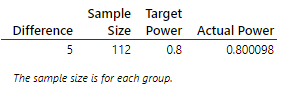
Increasing the sample size helps reduce the "random chance" variation in our statistic, but does not reduce the person-to-person variation in typing speeds. When the person-to-person variation is large, it will still be difficult for us to detect the underlying treatment difference in treatment means even if one truly exists. If the actual difference in typing speeds is 4 words per minute on average, we would need sample sizes on the order of 100 participants, in each group, to have at least 80% power.
How could you modify the experimental design to give you a better chance of detecting a difference in the average typing speeds between the two treatments if one exists? Be sure to explain why you believe this new design will be advantageous in detecting a difference between the two treatments.
In a paired design, rather than splitting the observational units into two distinct groups, they are paired in a way where we expect the observations within a pair to be more similar to each other than to observations in other pairs. This can explain some variation in the response variable.
For example, we can have each person take the typing test both with and without music. This allows us to compare the two typing speeds for each individual to each other, which should be very similar apart from the music, and to account for variation in typing speeds across individuals.
If there is no memory/advantage in taking the test the second time (or what advantage there is will be balanced out by the random assignment suggested in (i)), then they could be identical. Should at least be of the same level of difficulty.
The students originally wanted to compare music students to athletes. Explain how you could create a paired design using information on whether the participant was a music student or an athlete. Do you think this design will be as effective as the above design? Explain.
If we thought music students had similar typing abilities to each other, you could create pairs of music students, given one the typing test with music and one without music. Similarly for the athletes. But is unlikely that the students in a pair will be nearly the same in typing ability as measuring the same participant twice.
Suppose that a baseball manager wants to study whether a player can run from second base to home plate more quickly by taking a wide angle around third base or a narrow angle. Forty players are available to use as subjects in an experiment.
Suppose the players arrive for the study at different times. The manager decides to pair the first two arrivers and have them each do a different angle. The manager continues pairing the next two players as they arrive, etc. Is this a paired design? Is the paired design likely to be more effective than the completely randomized design in this case?
For each of the following research study designs, indicate whether the data collection plan will result in two independent samples (completely randomized design) or "dependent" samples (matched-pairs design).
A farmer wants to see whether referring to cows by name increases their milk production. He selects half of his cows at random, gives them names, and frequently calls them by name. The other half of his cows he does not call by name. Then he measured the milk production of each cow over one week.
A farmer wants to know whether hand-milking or machine-milking tends to produce more milk from cows. He examines records of how much milk the cows have produced in the past, and order them from most to least productive. For the top two milk producers, randomly assign one to hand-milking and the other to machine-milking. Do the same for the next two and the next two and so on.
You wonder whether students at your school tend to drive newer cars than faculty at your school. You take a random sample of 20 students and a random sample of 20 faculty members, and ask each person how old their car is.
To investigate whether knee surgery is effective, you randomly assign half of the subjects to receive knee surgery and the other half to undergo a "placebo" operation.
To investigate the effectiveness of an online language study program, participants were assigned to enroll in a six-week summer session, after which their language skills were assessed, and then to spend six-weeks using an online program (Duolingo), after which their language skills were assessed.