1. Identify study components.
Identify the variable and population of interest, the sample, and the sampling frame in this study. Also define the parameter and statistic, in words and symbols, and indicate any values that you know.
Variable:
Type:
Population of interest:
Sample:
Sampling frame:
Parameter:
Statistic:
Solution.
Variable: Presidential vote preference; Type: Categorical (binary)
Population of interest: All U.S. voters in 1936
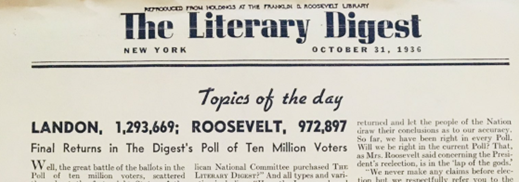
Sample: 2.4 million respondents
Sampling frame: Telephone books and vehicle registration lists
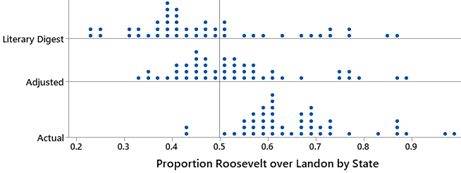
Parameter: \(\pi\) = proportion of all U.S. voters who actually voted for Alf Landon
Statistic: \(\hat{p} = 0.57\) = proportion of sample who responded they would vote for Landon