Section 6.1 Example 1.1: Predicting Elections from Faces?
Try these questions yourself before viewing the solutions.
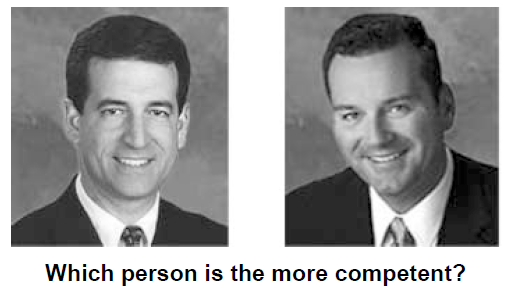
Do voters make judgments about a political candidate based on his or her facial appearance? Can you correctly predict the outcome of an election, more often than not, simply by choosing the candidate whose face is judged to be more competent looking?
Researchers investigated this question in a study published in Science (Todorov, Mandisodka, Goren, and Hall, 2005). Participants were shown pictures of two candidates and asked who has the more competent looking face.
Researchers then predicted the winner to be the candidate whose face was judged to look more competent by most of the participants. For the 32 U.S. Senate races in 2004, this method predicted the winner correctly in 23 of them.
Checkpoint 6.1.1. Calculate success proportion.
Checkpoint 6.1.2. State null hypothesis.
Describe (in words) the null hypothesis to be investigated with this study.
Checkpoint 6.1.3. Describe coin simulation.
Describe how you could (in principle) use a coin to produce a simulation analysis of whether these data provide strong evidence that the "competent face" method would correctly predict the election winner more than half the time. Include enough detail that someone else could implement the full analysis and draw a reasonable conclusion.
Solution.
You would flip a fair coin 32 times, once for each of the election races. Keep track of the number of heads, representing races for which the method correctly predicted the winner. Repeat simulating 32 flips a large number of times. Determine the proportion of samples in which 23 or more coin tosses resulted in heads. If this proportion is very small, conclude that the competent face method really does predict the winner correctly more than half the time.
Checkpoint 6.1.4. Conduct simulation test.
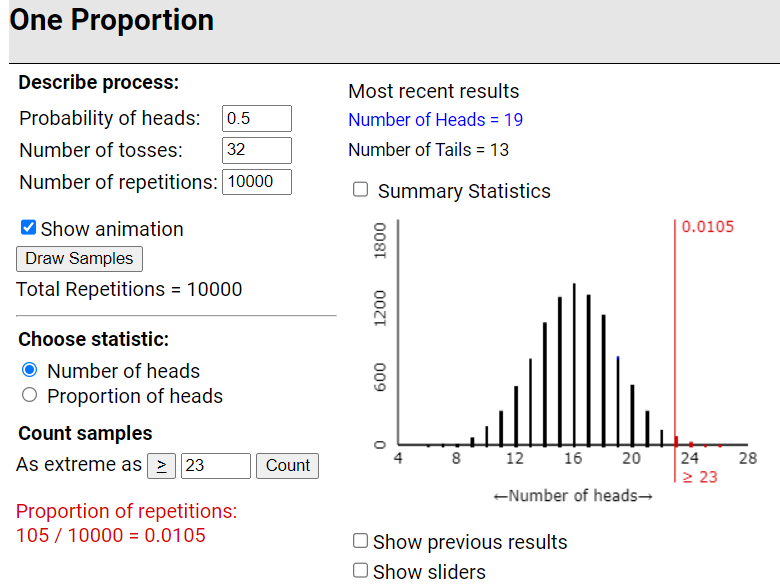
Use the One Proportion Inference applet to conduct a simulation (using 10,000 samples) addressing the question of whether the researchers’ results provide strong evidence in support of the researchers’ conjecture that the "competent face" method would correctly predict the election winner more than half the time. Be sure to report (and indicate on the dotplot), the p-value from the simulation.
Checkpoint 6.1.5. Interpret simulation results.
Write a paragraph, as if to the researchers, describing what your simulation analysis reveals about whether the data provide strong evidence in support of their conjecture.
Solution.
This analysis reveals that it would be quite surprising to correctly predict 23 or more of 32 election races if the "competent face" method were no better than flipping a coin. More specifically, such an extreme result would only occur about 1% of the time by random chance. So, the data provide fairly strong evidence in support of the researchers’ conjecture that the "competent face" method works more than half the time.
Checkpoint 6.1.6. Predict p-value for House races.
These researchers also predicted the outcomes of 279 races for the U.S. House of Representatives in 2004. The "competent face" method correctly predicted the winner in 189 of those races. Do you predict this p-value will be larger or smaller than in Question 4? Explain your reasoning.
Watch video walkthrough of this example.
You have attempted of activities on this page.
