Section 20.3 Investigation 4.6: Ice Cream Serving Sizes
In this investigation, you will apply two-sample t-procedures using summarized data.
Exercises 20.3.1 Two-sample t-confidence intervals
Researchers conducted a study in which they invited members of the Department of Food Science and Nutritional Science (faculty, graduate students, and staff) at a large midwestern university to an ice cream social (Mindless Eating: Why we eat more than we think, Wansink et al., 2006). The participants were randomly given either a 17- or a 34-ounce bowl.
Participants individually helped themselves to the available ice cream in the cafeteria line, unaware that other participants had been given different-sized bowls. The suspicion was that even nutrition experts would tend to take more ice cream when given a larger bowl. Sample results for the actual volumes of ice cream taken (in ounces) are summarized in the following table:
| Size \ Stats | Sample size | Sample mean | Sample SD |
|---|---|---|---|
| 17-ounce bowl | 20 | 4.38 | 2.05 |
| 34-ounce bowl | 17 | 5.81 | 2.26 |
Study Design and Hypotheses.
2. State Hypotheses.
Specify the null and alternative hypotheses for this research study, in symbols and in words, defining the parameter of interest in context.
Solution.
Let \(\mu_{17}\) represent the underlying treatment mean serving size of ice cream for people (in general) using the 17oz bowl. Let \(\mu_{34}\) represent the underlying treatment mean amount of ice cream for people (in general) using the 34oz bowl.
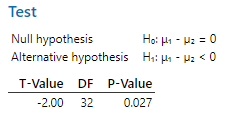
\(H_0: \mu_{17} - \mu_{34} = 0\) (there is no underlying difference in the treatment means)
\(H_a: \mu_{17} - \mu_{34} < 0\) (we expect, on average, larger serving sizes with the larger bowls)
3. Randomization Test Feasibility.
Would it be possible for you to carry out a randomization test using simulation with the information presented here?
Explain:
-
Yes
-
A randomization test requires the individual data values to reassign to groups. We only have summary statistics (means and standard deviations) here.
-
No
-
Correct! We would need the individual data values to carry out a randomization test. We only have summary statistics here.
Statistical Analysis.
4. Two-Sample t-Test and Confidence Interval.
Use technology to carry out a two-sample t-test to determine whether individuals given a 34-oz bowl have a tendency to serve themselves more ice cream than individuals given a 17-oz bowl. Be sure to report your standardized statistic and p-value. Also determine a 95% t-confidence interval for the difference in the long-run average serving size. State conclusion that addresses the statistical significance of the data, the magnitude of the difference in the population, whether you are willing to draw a cause-and-effect conclusion, and the population to which you are willing to generalize the results.
Aside: Theory-Based Inference Applet.
Solution.
With a p-value = 0.027 < 0.05, we would conclude that we do have convincing evidence that the larger bowl size causes (this was a randomized experiment) nutrition experts (not a random sample) to take larger servings of ice cream.
Using technology with 32 as the degrees of freedom, \(t^* = 2.037\) (By hand, with df = 16, \(t^* = 2.12\))
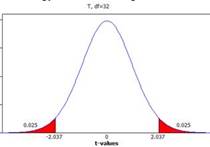
This is close to \(z^*\) but is a little larger, again reflecting the heavier tails/more uncertainty in our estimates from estimating \(\sigma\)’s with \(s\)’s.
\(-1.43 + 2.037\sqrt{2.05^2/20 + 2.26^2/17}\)
\(-1.43 + 1.4555\)
Margin of error: 1.4555
Interval: (-2.89, 0.025)
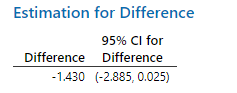
Interpretation: We are 95% confident that on average, the population with the 34 oz bowl will take between 0.025 fewer ounces up to 2.89 more ounces of ice cream than the population given a 17 ounce bowl.
5. Consistency of CI and p-value.
Is your confidence interval calculation consistent with the p-value you found with the test of significance? Explain.
Study Conclusions.
In this study, we find that the observed difference in the average serving size taken by nutrition experts using a 34-oz bowl is significantly larger than for those using the 17-oz bowl (p-value \(\approx\) 0.027). In fact, we can say that we are 95% confident that if we were to repeat these identical conditions indefinitely, those using the larger bowls would take on average up to 2.8555 more ounces of ice cream. However, the two-sided p-value is larger than 0.05, so our 95% CI does include zero, and it’s plausible that those using the smaller bowls will take on average up to 0.0255 more ounces of ice cream in the long-run.
Subsection 20.3.2 Practice Problem 4.6
Checkpoint 20.3.1. 99% Confidence Interval.
Calculate and interpret a 99% confidence interval for the ice cream data.
Checkpoint 20.3.2. 90% Confidence Interval.
How will this interval change if we lower the confidence level to 90%? Explain, without performing a calculation.
Checkpoint 20.3.3. Effect of Doubling Standard Deviations.
How will the width and/or midpoint of this interval change if both sample standard deviations are doubled? Be as specific as possible, and explain without determining the new confidence interval.
Checkpoint 20.3.4. Effect of Doubling Sample Sizes.
How will the width and/or midpoint of this interval change if both sample sizes are doubled? Be as specific as possible, and explain without determining the new confidence interval.
Checkpoint 20.3.5. Effect of Increasing Means.
How will the width and/or midpoint of this interval change if both sample means are increased by two ounces? Be as specific as possible, and explain without determining the new confidence interval.
You have attempted of activities on this page.
