Identify the observational units and population of interest.
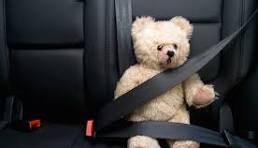
Section 6.3 Example 1.3: Seat Belt Usage
Try these questions yourself before viewing the solutions.
Every year since 1983 the Harris Poll has measured and reported the key lifestyle characteristics and behaviors which are known to have a major impact on health, disease, injury and life expectancy.
In 2011, the survey was conducted for the first time using both telephone interviews with online interviews for those who have no landlines or who mainly use cell phones (cell phone only and cell phone mostly adults). In this "nationwide cross section" of 1,987 adults, interviewed between April 11-18, 2011, 91% of adults claimed to always wear seat belts when they are in the front seat of a car.
Checkpoint 6.3.1. Identify observational units and population.
Checkpoint 6.3.2. Define population parameter.
Define the relevant population parameter in words.
Checkpoint 6.3.3. Construct confidence intervals.
Use this sample data to construct a 95% confidence interval for the population parameter using two different methods. Compare the results of your methods.
Solution.
We can use several methods because the population (all adults) is much larger than \(20 \times 1987 = 39,740\text{.}\) (\(X = 0.91 \times 1987 \approx 1808\))
For example, the Plus Four Method gives us (0.897, 0.922).
Aside: TBI Applet Output.
Aside: R Output.
Aside: JMP Output.
The intervals are very similar to each other as we would expect with the large sample size, though the binomial interval is a bit wider than the others.
These intervals tell us that we are 95% confident that between 90% and 92% of all U.S. adult drivers (claim to) always wear their seat belt. We are willing to generalize this result to all adult Americans because Harris conducted a nationwide poll, presumably using some random selecting techniques.
Checkpoint 6.3.4. Explain 95% confidence.
Explain what is meant by the phrase "95% confidence" for these procedures.
Solution.
If Harris Poll was to repeatedly take random samples of 1,987 adults and calculate a confidence interval for each one, then over thousands and thousands of such samples, we’d expect roughly 95% of the intervals to capture the actual value of the population proportion that (claim to) wear a seat belt.
Checkpoint 6.3.5. Identify potential bias.
Suggest a reason we might be skeptical that this confidence interval captures the proportion of adults who use a seat belt while in the front seat of a car.
Checkpoint 6.3.6. Suggest improvements to data collection.
Suggest some ways to guard against non-sampling errors in this study. That is, how might you collect the data to get a more accurate estimate of the proportion of drivers that actually use a seat belt.
Solution.
The researchers could observe drivers rather than only asking drivers. In fact, a 2001 study of 612 drivers coming to a convenience store in El Paso, Texas found 61.5% of the drivers actually wearing a seat belt. But when asked whether they always wear their seat belt, 75% of these same drivers said yes.
Researchers also worry about the tone used in asking questions and making sure every interviewer uses exactly the same language and demeanor when conducting a phone poll. In surveys with many questions, researchers will also rotate the order of questions to different respondents. Respondents can also be asked about related behaviors or past efforts (e.g., "did you vote last year" instead of "do you plan to vote").
Watch video walkthrough of this example.
You have attempted of activities on this page.
