Section 15.3 Investigation 3.7: CPR vs. Chest Compressions
In this investigation, you will apply the procedures you have just learned to a study comparing different ways of responding to a heart attack.
Exercises 15.3.1 The Study
For many years, if a person experienced a heart attack and a bystander called 911, the dispatcher instructed the bystander in how to administer chest compression plus mouth-to-mouth ventilation (a combination known as CPR) until the emergency team arrived. Some researchers believe that giving instruction in chest compression alone (CC) would be a more effective approach.
In the 1990s, a randomized comparative experiment was conducted in Seattle involving 518 cases (Hallstrom, Cobb, Johnson, & Copass, New England Journal of Medicine, 2000): In 278 cases, the dispatcher gave instructions in standard CPR to the bystander, and in the remaining 240 cases the dispatcher gave instructions in CC alone. A total of 64 patients survived to discharge from the hospital: 29 in the CPR group and 35 in the CC group.
2. Study Type.
Is this an observational study or an experiment?
-
Experiment
-
Observational study
3. Construct Two-Way Table.
Construct a two-way table to summarize the results of this study. Remember to put the explanatory variable in the columns.
| Outcome \ Method | CPR | CC alone | Total |
|---|---|---|---|
| Survived | |||
| Did not survive | |||
| Total |
Solution.
| Outcome \ Treatment | CPR | CC alone | Total |
|---|---|---|---|
| Survived | 29 | 35 | 64 |
| Did not survive | 249 | 205 | 454 |
| Total | 278 | 240 | 518 |
4. Calculate Difference.
5. Fisher’s Exact Test.
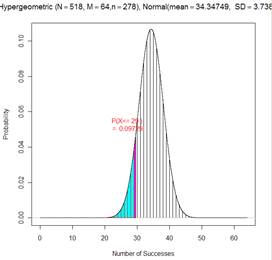
Use R or JMP to carry out Fisher’s Exact Test (by calculating the corresponding hypergeometric probability) to assess the strength of evidence that the probability of survival is higher with CC alone as compared to standard CPR. Write out how to calculate this probability, report the p-value, and interpret what it is the probability of.
Let \(X\) represent
p-value = \(P(X\) ) =
Interpretation:
Solution.
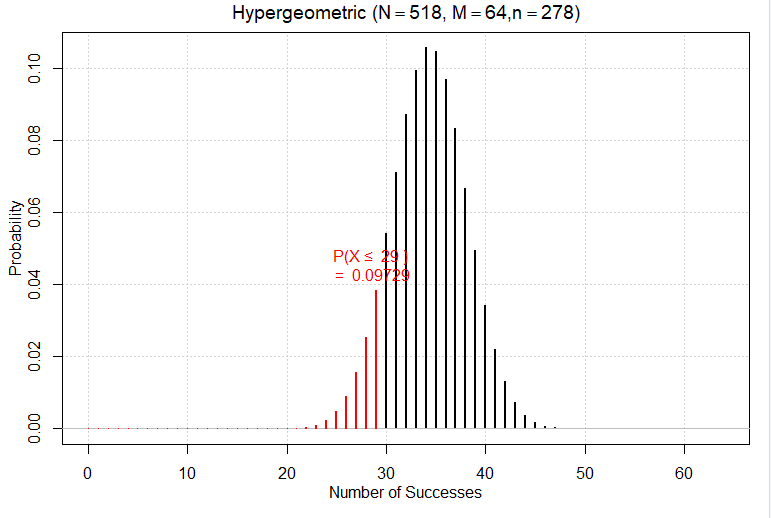
Let \(X\) represent the number of survivors in the CC group. Note, we are assessing the strength of evidence that the probability of survival is higher with CC alone.
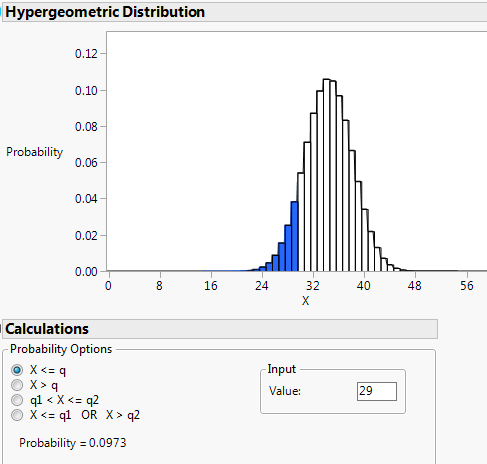
Interpretation: If the two treatments were equally effective, there would be about a 9.7% chance of getting 35 or more survivors in the CC group of 240 patients when randomly assigning all 518 patients to the two treatment groups.
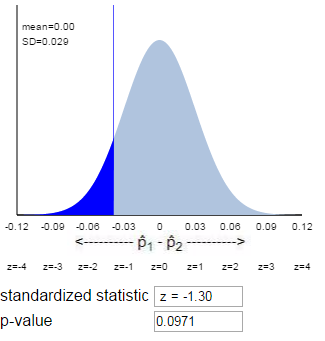
Example 15.3.1. Applet output.

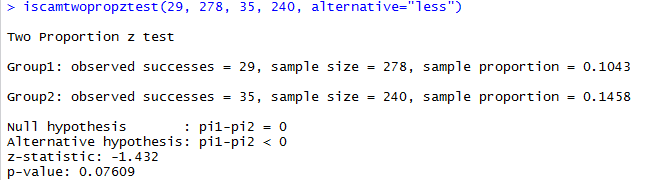
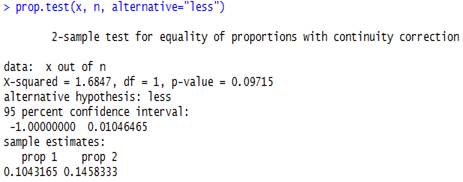
Example 15.3.2. R output.
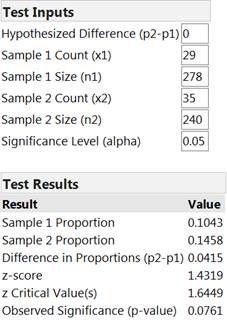
Example 15.3.3. JMP output.
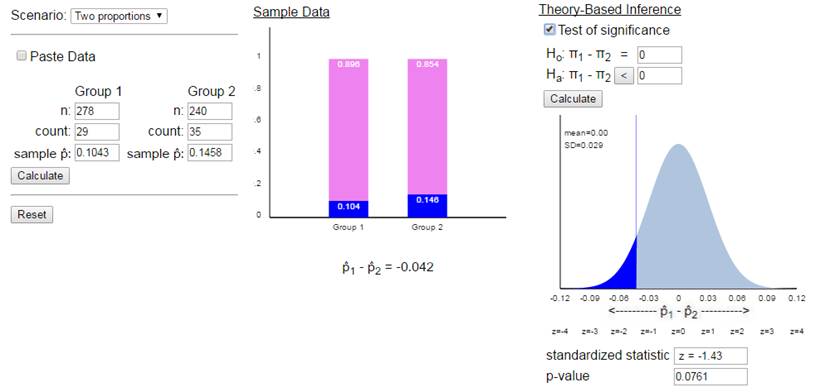
Because the sample sizes are large in this study, you should not be surprised that the probability distribution in Question 5 is approximately normal. The large sample sizes allow us to approximate the hypergeometric distribution with a normal distribution. Thus, with large samples sizes (e.g., at least 5 successes and at least 5 failures in each group), an alternative to Fisher’s Exact Test is the two-sample z-test that you studied in Investigation 3.1.
6. Two-Sample z-test.
7. Improving Approximation.
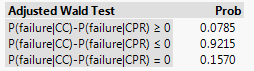
8. Optional: Continuity Correction.
Solution.
To make sure the probability mass at 35 is included, we could consider finding the probability for something just below 35 (e.g., 34.5) This changes the p-value approximation from .0763 to .0974, closer to the FET p-value of .0973.
Example 15.3.7. Applet.
Example 15.3.8. R.
Example 15.3.9. JMP.
9. Significance at Different Levels.
An advantage to using the z-procedures is being able to easily produce a confidence interval for the parameter.
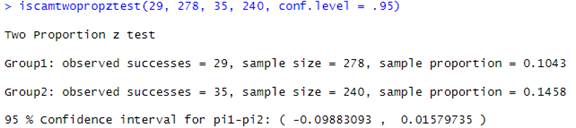
10. Confidence Interval.
Solution.
Using the two-sample z-interval:
95% CI for \(\pi_{CPR} - \pi_{CC}\text{:}\) (-0.0988, 0.0158)
I’m 95% confident that the survival probability is up to 0.0988 higher for the CC group but could be up to 0.0158 higher for the CPR group.
Example 15.3.10. Applet (with Adjusted Wald).
Example 15.3.11. R.
Example 15.3.12. JMP (with Adjusted Wald).

11. Reversing the Subtraction.
Solution.
(i) The observed statistic would now be positive 0.042 — change sign
(ii) The standardized statistic would now be positive (but same magnitude) — change sign
(iii) The alternative hypothesis would now be \(\pi_{CC} - \pi_{CPR} > 0\) — change direction
(iv) The p-value, now the probability of a statistic above 0.042, would be the same — no change
(v) The endpoints of the confidence interval will reverse sign — both endpoints change sign
Note: Even with a 90% confidence level, zero is captured in the interval, even though we rejected the null hypothesis for a 10% level of significance. This can happen when you compare a one-sided p-value to a confidence interval which corresponds to a two-sided p-value. The other issue is even 0.0896 is not all that large of a value, so even if you consider the difference statistically significant, it’s not clear whether the CC treatment has a "large" benefit.
Subsection 15.3.2 Practice Problem 3.7A
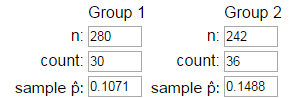
Researchers in the CPR study also examined other response variables. For example, the 911 dispatcher’s instructions were completely delivered in 62% of episodes assigned to chest compression plus mouth-to-mouth compared to 81% of the episodes assigned to chest compression alone.
Checkpoint 15.3.13. Difference in Proportions.
Calculate the difference in conditional proportions and compare it to the original study.
Checkpoint 15.3.14. p-value Comparison.
Without calculating, do you suspect the p-value for comparing this new response variable between the two groups will be larger or smaller or about the same as the p-value you determined above? Explain your reasoning.
Subsection 15.3.3 Practice Problem 3.7B
The above study was operationally identical to that of another study and the results of the two studies were combined. Of the 399 combined patients randomly assigned to standard CPR, 44 survived to discharge from the hospital. Of the 351 combined patients randomly assigned to chest compression alone, 47 survived to discharge.
Checkpoint 15.3.15. Combined Study Difference.
Calculate the difference in conditional proportions and compare it to the original study.
Checkpoint 15.3.16. Combined Study p-value.
Without calculating, do you suspect the p-value for this comparison will be larger, smaller, or the same as the p-value you determined? Explain your reasoning.
You have attempted of activities on this page.
