Each row in the table below is a proposed grade distribution for a class. Identify each as a valid or invalid probability distribution, and explain your reasoning.
The Behavioral Risk Factor Surveillance System (BRFSS) is an annual telephone survey designed to identify risk factors in the adult population and report emerging health trends. The following table summarizes two variables for the respondents: health status and health coverage, which describes whether each respondent had health insurance. 1
Offce of Surveillance, Epidemiology, and Laboratory Services Behavioral Risk Factor Surveillance System, BRFSS 2010 Survey Data.
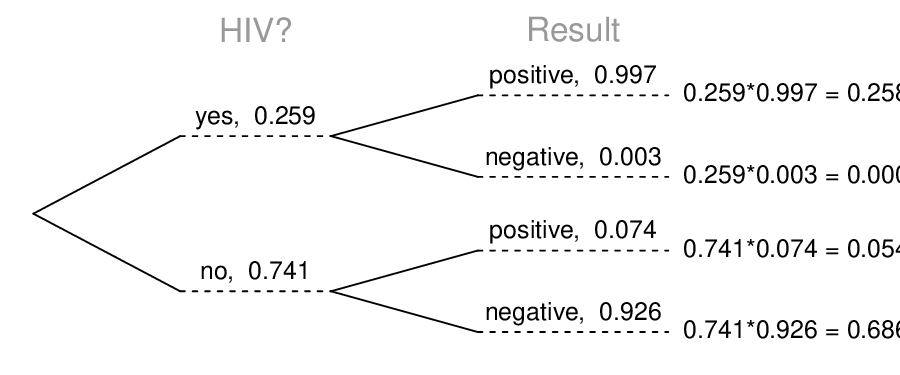
. The ELISA test is one of the first and most accurate tests for HIV. For those who carry HIV, the ELISA test is 99.7% accurate. For those who do not carry HIV, the test is 92.6% accurate. If an individual from Swaziland has tested positive, what is the probability that he carries HIV?
About 30% of human twins are identical, and the rest are fraternal. Identical twins are necessarily the same sex - half are males and the other half are females. One-quarter of fraternal twins are both male, one-quarter both female, and one-half are mixes: one male, one female. You have just become a parent of twins and are told they are both girls. Given this information, what is the probability that they are identical?
Sally gets a cup of coffee and a muffin every day for breakfast from one of the many coffee shops in her neighborhood. She picks a coffee shop each morning at random and independently of previous days. The average price of a cup of coffee is $1.40 with a standard deviation of 30¢ ($0.30), the average price of a muffin is $2.50 with a standard deviation of 15¢, and the two prices are independent of each other.
What is the mean and standard deviation of the amount she spends on breakfast daily?
Ice cream usually comes in 1.5 quart boxes (48 fluid ounces), and ice cream scoops hold about 2 ounces. However, there is some variability in the amount of ice cream in a box as well as the amount of ice cream scooped out. We represent the amount of ice cream in the box as \(X\) and the amount scooped out as \(Y\text{.}\) Suppose these random variables have the following means, standard deviations, and variances:
An entire box of ice cream, plus 3 scoops from a second box is served at a party. How much ice cream do you expect to have been served at this party? What is the standard deviation of the amount of ice cream served?
How much ice cream would you expect to be left in the box after scooping out one scoop of ice cream?That is, find the expected value of \(X-Y\text{.}\) What is the standard deviation of the amount left in the box?
The university gym opens at 9 am on Saturday mornings. One Saturday morning at 8:55 am there are 27 students outside the gym waiting for it to open. Should you use the same approach from part (a) to calculate the expected number of smokers among these 27 students?
No, these 27 students are not a random sample from the university’s student population. For example, it might be argued that the proportion of smokers among students who go to the gym at 9 am on a Saturday morning would be lower than the proportion of smokers in the university as a whole.
Exercise 2.6.11 states that the distribution of speeds of cars traveling on the Interstate 5 Freeway (I-5) in California is nearly normal with a mean of 72.6 miles/hour and a standard deviation of 4.78 miles/hour. The speed limit on this stretch of the I-5 is 70 miles/hour.
A highway patrol officer is hidden on the side of the freeway. What is the probability that 5 cars pass and none are speeding? Assume that the speeds of the cars are independent of each other.
On average, how many cars would the highway patrol officer expect to watch until the first car that is speeding? What is the standard deviation of the number of cars he would expect to watch?
In the game of roulette, a wheel is spun and you place bets on where it will stop. One popular bet is that it will stop on a red slot; such a bet has an \(18/38\) chance of winning. If it stops on red, you double the money you bet. If not, you lose the money you bet. Suppose you play 3 times, each time with a $1 bet. Let \(Y\) represent the total amount won or lost. Write a probability model for \(Y\text{.}\)
In a multiple choice quiz there are 5 questions and 4 choices for each question (a, b, c, d). Robin has not studied for the quiz at all, and decides to randomly guess the answers. What is the probability that
the first question she gets right is the \(3^{\text{rd}}\) question?