Understand the four steps of a statistical investigation (identify a question, collect data, analyze data, form a conclusion) in the context of a real-world example.
Section 1.1 introduces a classic challenge in statistics: evaluating the efficacy of a medical treatment. Terms in this section, and indeed much of this chapter, will all be revisited later in the text. The plan for now is simply to get a sense of the role statistics can play in practice.
Stents are devices put inside blood vessels that assist in patient recovery after cardiac events and reduce the risk of an additional heart attack or death. Many doctors have hoped that there would be similar benefits for patients at risk of stroke. We start by writing the principal question the researchers hope to answer:
The researchers who asked this question collected data on 451 at-risk patients. Each volunteer patient was randomly assigned to one of two groups:
Treatment group. Patients in the treatment group received a stent and medical management. The medical management included medications,management of risk factors, and help in lifestyle modification.
Researchers randomly assigned 224 patients to the treatment group and 227 to the control group. In this study, the control group provides a reference point against which we can measure the medical impact of stents in the treatment group.
Researchers studied the effect of stents at two time points: 30 days after enrollment and 365 days after enrollment. The results of 5 patients are summarized in Table 1.1.1. Patient outcomes are recorded as “stroke” or “no event”, representing whether or not the patient had a stroke at the end of a time period.
Considering data from each patient individually would be a long, cumbersome path towards answering the original research question. Instead, performing a statistical data analysis allows us to consider all of the data at once. Table 1.1.2 summarizes the raw data in a more helpful way. In this table, we can quickly see what happened over the entire study. For instance, to identify the number of patients in the treatment group who had a stroke within 30 days, we look on the left-side of the table at the intersection of the treatment and stroke: 33.
What proportion of the patients in the treatment group had no stroke within the first 30 days of the study? (Please note: answers to all Guided Practice exercises are provided using footnotes.) 2
There were 191 patients in the treatment group that had no stroke in the first 30 days. There were \(33 + 191 = 224\) total patients in the treatment group, so the proportion is \(191 / 224 = 0.85\text{.}\)
We can compute summary statistics from the table. A summary statistic is a single number summarizing a large amount of data. 3
Formally, a summary statistic is a value computed from the data. Some summary statistics are more useful than others.
For instance, the primary results of the study after 1 year could be described by two summary statistics: the proportion of people who had a stroke in the treatment and control groups.
Proportion who had a stroke in the treatment (stent) group: \(45/224 = 0.20 = 20\%\text{.}\)
These two summary statistics are useful in looking for differences in the groups, and we are in for a surprise: an additional 8% of patients in the treatment group had a stroke! This is important for two reasons. First, it is contrary to what doctors expected, which was that stents would reduce the rate of strokes. Second, it leads to a statistical question: do the data show a “real” difference between the groups?
This second question is subtle. Suppose you flip a coin 100 times. While the chance a coin lands heads in any given coin flip is 50%, we probably won’t observe exactly 50 heads. This type of fluctuation is part of almost any type of data generating process. It is possible that the 8% difference in the stent study is due to this natural variation. However, the larger the difference we observe (for a particular sample size), the less believable it is that the difference is due to chance. So what we are really asking is whether the difference is statistically significant, that is, whether the difference so large that we should reject the notion that it was due to chance.
While we don’t yet have the statistical tools to fully address this question on our own, we can comprehend the conclusions of the published analysis: there was compelling evidence of harm by stents in this study of stroke patients.
Be careful: do not generalize the results of this study to all patients and all stents. This study looked at patients with very specific characteristics who volunteered to be a part of this study and who may not be representative of all stroke patients. In addition, there are many types of stents and this study only considered the self-expanding Wingspan stent (Boston Scientific). However, this study does leave us with an important lesson: we should keep our eyes open for surprises.
To test the effectiveness of a treatment, researchers often carry out an experiment in which they randomly assign patients to a treatment group or a control group.
Ultimately, researchers want to know whether the difference between the two groups is significant, that is, larger than what would be expected by chance alone.
A migraine is a particularly painful type of headache, which patients sometimes wish to treat with acupuncture. To determine whether acupuncture relieves migraine pain, researchers conducted a randomized controlled study where 89 females diagnosed with migraine headaches were randomly assigned to one of two groups: treatment or control. 43 patients in the treatment group received acupuncture that is specifically designed to treat migraines. 46 patients in the control group received placebo acupuncture (needle insertion at non-acupoint locations). 24 hours after patients received acupuncture, they were asked if they were pain free. Results are summarized in the contingency table below. 4
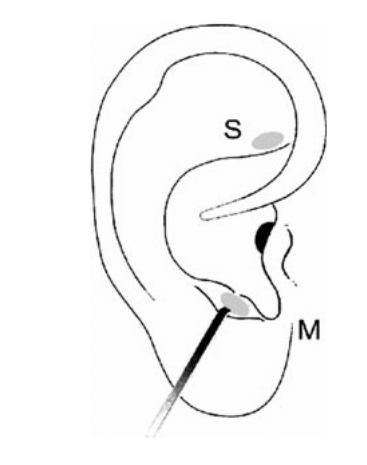
Figure1.1.5.Figure from the original paper displaying the appropriate area (M) versus the inappropriate area (S) used in the treatment of migraine attacks.
Your findings so far might suggest that acupuncture is an effective treatment for migraines for all people who suffer from migraines. However this is not the only possible conclusion that can be drawn based on your findings so far. What is one other possible explanation for the observed difference between the percentages of patients that are pain free 24 hours after receiving acupuncture in the two groups?
Researchers studying the effect of antibiotic treatment for acute sinusitis compared to symptomatic treatments randomly assigned 166 adults diagnosed with acute sinusitis to one of two groups: treatment or control. Study participants received either a 10-day course of amoxicillin (an antibiotic) or a placebo similar in appearance and taste. The placebo consisted of symptomatic treatments such as acetaminophen, nasal decongestants, etc. At the end of the 10-day period, patients were asked if they experienced improvement in symptoms. The distribution of responses is summarized below. 5
Your findings so far might suggest a real difference in effectiveness of antibiotic and placebo treatments for improving symptoms of sinusitis. However, this is not the only possible conclusion that can be drawn based on your findings so far. What is one other possible explanation for the observed difference between the percentages of patients in the antibiotic and placebo treatment groups that experience improvement in symptoms of sinusitis?