The paragraph below describes the set up for such approach, if we were to do it without using statistical software. Fill in the blanks with a number or phrase, whichever is appropriate. We write
alive on
cards representing patients who were alive at the end of the study, and
dead on
cards representing patients who were not. Then, we shuffle these cards and split them into two groups: one group of size
representing treatment, and another group of size
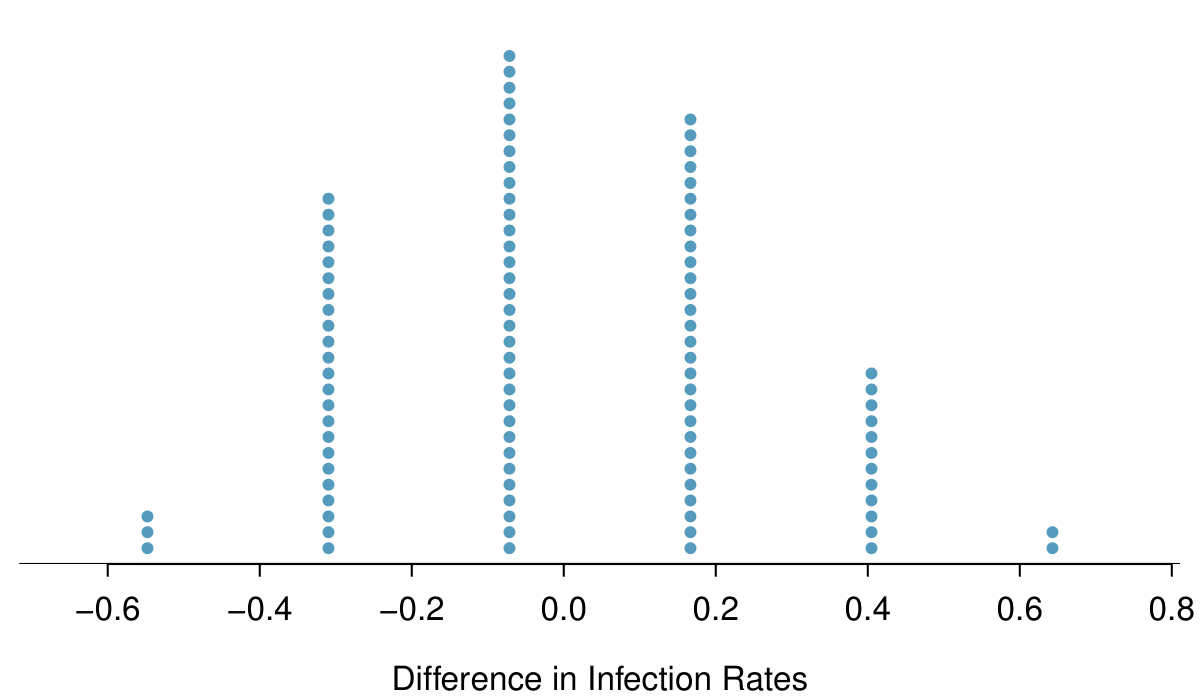
representing control. We calculate the difference between the proportion of
dead cards in the treatment and control groups (treatment - control) and record this value. We repeat this 100 times to build a distribution centered at
. Lastly, we calculate the fraction of simulations where the simulated differences in proportions are
. If this fraction is low, we conclude that it is unlikely to have observed such an outcome by chance and that the null hypothesis should be rejected in favor of the alternative.