Section 5.4 Summarizing Data
Next, we will examine another very useful function called
summary() which provides some overlapping information to str() but also goes a little bit further, particularly with numeric variables.
Here’s what we get:
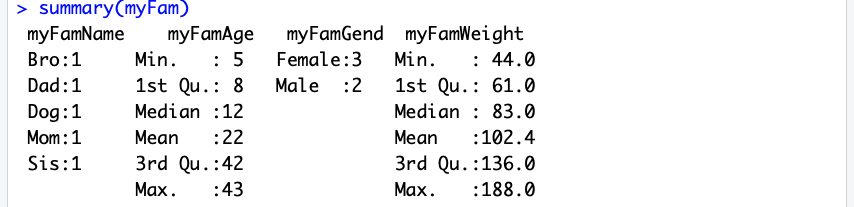
summary() function is performed on an existing data frame.In order to fit on the page properly, these columns have been reorganized a bit. The name of a column/variable, sits up above the information that pertains to it, and each block of information is independent of the others (so it is meaningless, for instance, that "Bro: 1" and "Min." happen to be on the same line of output). Notice, as with
str(), that the output is quite different depending upon whether we are talking about a Factor, like myFamName or myFamGend, versus a numeric variable like myFamAge and myFamWeight. The columns for the Factors list out a few of the Factor names along with the number of occurrences of cases that are coded with that factor. So for instance, under myFamGend it shows three females and two males. In contrast, for the numeric variables we get five different calculated quantities that help to summarize the variable. There’s no time like the present to start to learn about what these are, so here goes:
-
Min refers to the minimum or lowest value among all the cases. For this dataframe, 5 is the age of the dog and it is the lowest age of all of the family members.
-
1st Qu refers to the dividing line at the top of the first quartile. If we took all the cases and lined them up side by side in order of age (or weight) we could then divide up the whole into four groups, where each group had the same number of observations.
In other words, the four quartiles are as follows:
-
1ST Quartile: 5% of cases with the smallest values are here.
-
2ND Quartile: 25% of cases just below the median are here.
-
3RD Quartile: 25% of cases just above the median are here.
-
4TH Quartile: 25% of cases with the largest values are here.
Just like a number line, the smallest cases would be on the left with the largest on the right. If we’re looking at
myFamAge, the leftmost group, which contains one quarter of all the cases, would start with five on the low end (the dog) and would have eight on the high end (Bro). So the first quartile is the value of age (or another variable) that divides the first quarter of the cases from the other three quarters. Note that if we don’t have a number of cases that divides evenly by four, the value is an approximation.
-
Median refers to the value of the case that splits the whole group in half, with half of the cases having higher values and half having lower values. If you think about it a little bit, the median is also the dividing line that separates the second quartile from the third quartile.
-
Mean, as we have learned before, is the numeric average of all of the values. For instance, the average age in the family is reported as 22.
-
3rd Qu is the third quartile. If you remember back to the first quartile and the median, this is the third and final dividing line that splits up all of the cases into four equal sized parts. You may be wondering about these quartiles and what they are useful for. Statisticians like them because they give a quick sense of the shape of the distribution. Everyone has the experience of sorting and dividing things up pieces of pizza, playing cards into hands, a bunch of players into teams and it is easy for most people to visualize four equal sized groups and useful to know how high you need to go in age or weight (or another variable) to get to the next dividing line between the groups.
-
Finally, Max is the maximum value and as you might expect displays the highest value among all of the available cases. For example, in this dataframe Dad has the highest weight: 188. Seems like a pretty trim guy.
You have attempted of activities on this page.
