Section 11.2 Understanding Association Rules
Let’s begin by talking a little bit about association rules. Take a look at the figure below with all of the boxes and arrows:
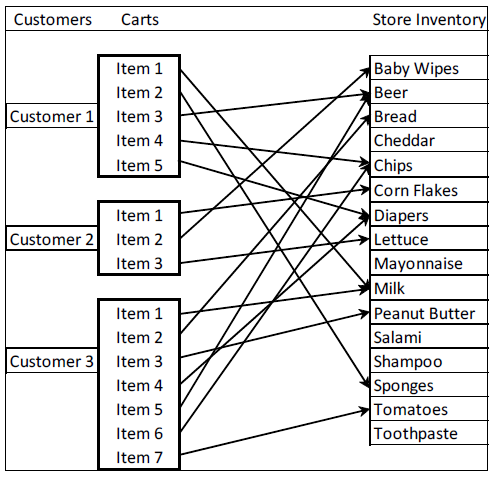
From the figure you can see that each supermarket customer has a grocery cart that contains several items from the larger set of items that the grocery store stocks. The association rules algorithm (also sometimes called affinity analysis) tries out many different propositions, such as "if diapers are purchased, then beer is also purchased." The algorithm uses a dataset of transactions (in the example above, these are the individual carts) to evaluate a long list of these rules for a value called "support." Support is the proportion of times that a particular pairing occurs across all shopping carts. The algorithm also evaluates another quantity called "confidence," which is how frequently a particular pair occurs among all the times when the first item is present. If you look back at the figure again, we had support of 0.67 (the diapers-beer association occurred in two out of the three carts) and confidence of 1.0 ("beer" occurred 100% of the time with "diapers"). In practice, both support and confidence are generally much lower than in this example, but even a rule with low support and smallish confidence might reveal purchasing patterns that grocery store managers could use to guide pricing, coupon offers, or advertising strategies.
You have attempted of activities on this page.
