Note 6.11.1.
This workspace is provided for your convenience. You can use this activecode window to try out anything you like.
write. For example, alex.write("Hello") would write the string hello at the current position.
begin_fill, for example alex.begin_fill(). Then you draw the shape. Finally, you call end_fill ( alex.end_fill()).
fillcolor, for example, alex.fillcolor("red").
xs = [48, 117, 200, 240, 160, 260, 220]

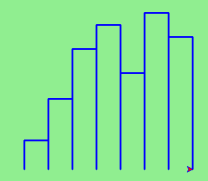
drawBar, that will need a turtle and the height of the bar. We will assume that the width of the bar will be 40 units. Once we have the function, we can use a basic for loop to process the list of data values.
def drawBar(t, height):
    """ Get turtle t to draw one bar, of height. """
    t.left(90)               # Point up
    t.forward(height)        # Draw up the left side
    t.right(90)
    t.forward(40)            # width of bar, along the top
    t.right(90)
    t.forward(height)        # And down again!
    t.left(90)               # put the turtle facing the way we found it.

...
for v in xs:                 # assume xs and tess are ready
    drawBar(tess, v)
drawBar by adding t.write(str(height)) as the new fourth line of the body. Note that we had to turn the number into a string. Finally, we’ll add the two methods needed to fill each bar.
setworldcoordinates method to rescale the window. While we are at it, we should make the window fit the data. The tallest bar will correspond to the maximum data value. The width of the window will need to be proportional to the number of bars (the number of data values) where each has a width of 40. Using this information, we can compute the coordinate system that makes sense for the data set. To make it look nice, we’ll add a 10 unit border around the bars.
drawBar code, moving the label up slightly but not changing the bar? Hint: The label cannot be drawn during the polygon fill sequence.