
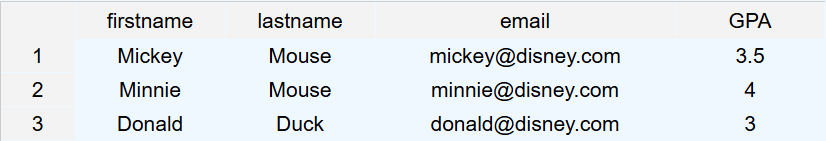
Activity 11.2.1.
Put the following pseudo code algorithm steps for calculating the average GPA of the students in the table above. Make sure some of the steps are indented to be inside the loop. Click on Check Me to see if you are right.
Scanner.nextLine or Files.readAllLines to get the contents of a file broken up into individual lines. But if we want to do computations with that data we will usually need to extract the individual parts of each line and maybe convert them into types like int or double to work with. The process of extracting structure from a linear sequence of such as the characters in a String is called parsing.
pokemon.csv from the previous section into data we can work with.
Number,Pokemon,Type 1,Type 2,HP,Attack,Defense,Speed,PNG,Description
String class provides a useful method split(String delimiter) that splits a string into an array of String values based on a specified delimiter which is a character like a comma or a space that separates the units of data. This method returns a String[] where each element in the array contains one substring from the original string.
String sentence = "A quick brown fox jumps";
// Split the sentence into words along spaces to create:
//  words = {"A", "quick", "brown", "fox", "jumps"}
String[] words = sentence.split(" ");
split method to split a line from the Pokémon csv file into individual attributes. Looking at header in the first line of the file, we can see that the 0th element of the data array is the Pokémon’s number, element 1 is the name, etc. We only need to save the data that we want to use. In this case, we want to save the name, type1, and imageFile.
// Split the line of data into an array of Strings
String[] data = line.split(",");
// Identify the data
// data: Number,Name,Type1,Type2,HP,Attack,Defense,Speed,PNG,Description
String name = data[1];
String type1 = data[2];
String imageFile = data[8];
split method to extract names and URLs saved in the file.
randomPokemon method to print out a random pokemon name and its image using the split method. Run the program multiple times to see different Pokémon names and images.
String is fine. But the attributes, HP, Attack, Defense, or Speed are numbers so if we want to answer questions about them, we will need to convert the String values we get from split into int or double values we can do math with.
Integer and Double wrapper classes we learned about in Section 10.2 Wrapper classes also have some useful static methods for converting String values to int and double values. They are Integer.parseInt and Double.parseDouble.
Integer.parseInt method to convert the speed from a string to an integer so we can compare the speeds.
findMaxSpeed and findAverageSpeed methods below.
String arrays and then parsing the individual values as needed, it’s a bit cumbersome to keep track of which indexes go with which attributes and to read code that uses those indexes everywhere.
Pokemon class where each instance represents a single Pokémon.
ArrayList of Pokemon objects by parsing each line (except the header) into the attributes for one Pokémon and using them to construct a Pokemon object. Then in the rest of our program we can use getters defined in the Pokemon class to access the attributes of different Pokémon without having to remember which index to use.
Pokemon class with instance variables for the attributes we care about, and a constructor that initializes these variables. Assuming that we have already written the Pokemon class and constructor, the following code creates a Pokemon object from the data using its constructor and saves it into an array of Pokemon objects.
// Create a list to hold Pokemon objects
ArrayList<Pokemon> pokemon = new ArrayList<>();

// Skip the header line
if (scan.hasNextLine()) scan.nextLine();

while (scan.hasNextLine()) {
    String line = scan.nextLine();
    String[] data = line.split(",");

    // Create a Pokemon object from the data and add to list.
    pokemon.add(new Pokemon(data[1], data[2], Integer.parseInt(data[7]), data[8]));
}
Pokemon that has at least three attributes that can be found in the Pokémon file, including its name, type1, and imagefile, and any other attributes from the file that you would like. Write a constructor and getters for these attributes.
Pokemon objects.
findType method that returns to the type of a Pokemon given its name as an argument. It should loop through the array to find the right Pokemon object using the getName and getType methods that you will write. It should also display the image for the Pokémon.
java.net package following the directions here https://docs.oracle.com/javase/tutorial/networking/urls/readingURL.html.
toString method as well.
File object, using the name of the file as the argument of the constructor. File(String str) is the File constructor that accepts a String file name to open for reading, where str is the pathname for the file.
File class, it is required to indicate what to do if the file with the provided name cannot be opened. One way to accomplish this is to add throws IOException to the header of the method that uses the file. If the file name is invalid, the program will terminate.
File and IOException classes are part of the java.io package. An import statement must be used to make these classes available for use in the program.
Scanner methods and constructor—including what they do and when they are used—are part of the Java Quick Reference (p. 2) provided during the AP CSA exam:
Scanner(File f) the Scanner constructor that accepts a File for reading.
int nextInt() returns the next int read from the file or input source. If the next int does not exist, it will result in an InputMismatchException. Note that this method does not read the end of the line, so the next call to nextLine() will return the rest of the line which will be empty.
double nextDouble() returns the next double read from the file or input source. If the next double does not exist, it will result in an InputMismatchException.
boolean nextBoolean() returns the next Boolean read from the file or input source. If the next boolean does not exist, it will result in an InputMismatchException.
String nextLine() returns the next line of text up until the end of the line as a String read from the file or input source; returns the empty string if called immediately after another Scanner method like nextInt that is reading from the file or input source;returns null if there is no next line.
String next() returns the next String up until a white space read from the file or input source.
boolean hasNext() returns true if there is a next item to read in the file or input source; false otherwise.
void close() closes the input stream.
nextLine and the other Scanner methods together on the same input source sometimes requires code to adjust for the methods’ different ways of handling whitespace.
String method—including what it does and when it is used—is part of the Java Quick Reference provided during the AP CSA Exam:
String[] split(String del) returns a String array where each element is a substring of this String, which has been split around matches of the given expression del.
String[] data = line.split(","); splits a line from a csv file along the commas and saves the substrings into the array data.
while loop can be used to detect if the file still contains elements to read by using the hasNext method as the condition of the loop.
close method from Scanner is called to close the file.
