Can we find higher degree polynomials that approximate \(f(x) = e^x\) near \(a = 0\) more effectively than the approximation generated by the tangent line?
Early in our study of calculus in Section 1.8, we learned that if a function \(f\) has a derivative at a fixed value \(x=a\text{,}\) when we zoom in on its graph near \((a,f(a))\text{,}\) the function looks linear. Indeed, such a function is differentiable, and we know that near a fixed input value \(a\text{,}\)
In this section, we use the function \(f(x) = e^x\) as a case study to investigate how we can use other basic functions to better approximate the value of \(f(x)\) near \(a = 0\text{.}\)
Consider the function \(f(x) = e^x\) near \(a = 0\text{.}\) We know that \(f’(x) = e^x\text{,}\) so \(f’(0) = 1\text{;}\) along with the fact that \(f(0) = 1\text{,}\) it follows that the tangent line approximation is
Build a spreadsheet that computes the difference between \(f(x)\) and \(L(x)\) for \(x\)-values between \(-1\) and \(1\text{,}\) spaced \(0.1\) units apart. Note: we will revisit this spreadsheet for additional computations in Activity 8.1.4, so it would be ideal if you save your work electronically in place you can find it later.
Notice that the curvature in \(f(x) = e^x\) is what makes the linear approximation \(L(x)\) lose accuracy. What kind of simple function might do a better job approximating \(e^x\) than a linear one?
In Preview Activity 8.1.1, we found that the error in the tangent line approximation of \(f(x) = e^x\) at \(a = 0\) grows significantly as we consider \(x\)-values further and further from \(0\text{.}\) This is due to the fact that the tangent line is straight while the function \(f(x) = e^x\) has some curvature. To hopefully improve the approximation, we are going to try to find a quadratic function whose curvature matches that of \(f(x) = e^x\) at the point of tangency.
While we have usually used the notation “\(L(x)\)” for the tangent line, in what follows we will instead write “\(T_1(x)\)”, and think of this as “the degree \(1\) approximation”. In a similar way, we will write “\(T_2(x)\)” for the quadratic (degree \(2\)) approximation.
Moreover, the functions \(T_1\) and \(f\) have two exact values in common. First, their function values agree at the point of tangency: \(T_1(0) = f(0)\text{.}\) And second, since \(T_1(x)\) is a linear function whose slope is \(f'(0)\text{,}\) it is also true that their derivative values agree at the point of tangency: \(T_1'(0) = f'(0)\text{.}\)
To generate a quadratic function that approximates \(f\) near \(a = 0\text{,}\) we choose to have this quadratic function not only share the same function value and derivative value as \(f\) at \(a=0\text{,}\) but also the same second derivative value 1
Here we are implicitly assuming that the function \(f(x)\) has a second derivative at \(a=0\text{,}\) which is a property that holds for \(f(x) = e^x\text{.}\)
at \(a=0\) in order to match the concavity or curvature of \(f\text{.}\) In other words, we are adding a term to the linear approximation that gives the same amount of curvature as the function \(f\text{.}\)
In Activity 8.1.2, we explore how these three requirements determine \(b_0\text{,}\)\(b_1\text{,}\) and \(b_2\) in \(T_2(x)\) for the function \(f(x) = e^x\text{.}\)
Let \(f(x)=e^x\) and \(T_2(x) = b_0 + b_1 x + b_2 x^2\text{.}\) We seek numerical values for the constants \(b_0\text{,}\)\(b_1\text{,}\) and \(b_2\) so that \(f(0)=T_2(0)\text{,}\)\(f'(0)=T_2'(0)\text{,}\) and \(f''(0)=T_2''(0)\text{.}\)
Note that since \(b_0\text{,}\)\(b_1\text{,}\) and \(b_2\) are constants, if we take the derivative of the quadratic function \(T_2\) using the sum and constant multiple rules, it follows that \(T_2'(x) = b_1 + 2 b_2 x\text{.}\)
Next, observe that since \(T_2(x) = b_0 + b_1 x + b_2 x^2\text{,}\) it follows that \(T_2(0) = b_0\text{.}\) Reason similarly to determine the values of \(T_2'(0)\) and \(T_2''(0)\text{,}\) as well as those of \(f(0)\text{,}\)\(f'(0)\text{,}\) and \(f''(0)\) and enter these values appropriately in the blanks below.
Now, recall that we want the function values, first derivative values, and second derivative values of \(f\) and \(T_2\) to match at \(a = 0\text{.}\) What does \(T_2(0) = f(0)\) tell us about the value of \(b_0\text{,}\) and what is its value? What does \(T_2'(0) = f'(0)\) imply the value of \(b_1\) is? How can we reason similarly to find \(b_2\text{?}\)
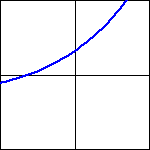
Having now determined the numerical values of \(b_0\text{,}\)\(b_1\text{,}\) and \(b_2\text{,}\) use appropriate computing technology to plot the function \(T_2(x) = b_0 + b_1 x + b_2 x^2\) along with \(f(x)=e^x\) and \(T_1(x)=1+x\) in the same window as that shown in Figure 8.1.3.
A remarkable feature of mathematics is that when a process effectively generates an approximation, doing that same process again (perhaps with some slight modifications) often improves the approximation. In Activity 8.1.2, we found a quadratic approximation of \(f(x)=e^x\) near the point \((0,f(0))\) that results in an improvement over the linear approximation of \(f\text{.}\) It is reasonable to hope that a degree 3 polynomial approximation of \(f(x) = e^x\) will be even better.
We are using the unknown constants \(c_0\text{,}\)\(c_1\text{,}\)\(c_2\text{,}\) and \(c_3\) for \(T_3(x)\) instead of the constants \(b_0\text{,}\)\(b_1\text{,}\) and \(b_2\) that we considered for \(T_2(x)\) since we don’t yet know whether the first three values of \(c_i\) will be the same as those of \(b_i\) or not.
We continue our investigation of this new approximation of \(f(x) = e^x\) in Activity 8.1.3, where we work to determine the values of \(c_0\text{,}\)\(c_1\text{,}\)\(c_2\text{,}\) and \(c_3\) plus explore how well \(T_3(x)\) approximates \(f(x)\) near \(a = 0\text{.}\)
By computing the third derivative of \(f(x)\) and the second and third derivatives of \(T_3(x)\) and evaluating the relevant functions at \(x = 0\text{,}\) fill in the blanks below.
Next, recall that we want \(f\) and \(T_3\) to share the same function and derivative values at \(a = 0\) up to and including the third derivative. For instance, one of the four needed equations is \(T_3'(0) = f'(0)\text{.}\) Use the four equations your work in the preceding question to determine the values of \(c_0\text{,}\)\(c_1\text{,}\)\(c_2\text{,}\) and \(c_3\text{.}\)
Having now determined the numerical values of \(c_0\text{,}\)\(c_1\text{,}\)\(c_2\text{,}\) and \(c_3\text{,}\) use appropriate computational technology to plot the function \(T_3(x) = c_0 + c_1 x + c_2 x^2 + c_3 x^3\) along with \(f(x)=e^x\text{,}\)\(T_1(x)=1+x\text{,}\) and \(T_2(x) = 1 + x + \frac{1}{2}x^2\) in the same window as shown in Figure 8.1.7.
Figure8.1.7.The function \(f(x)=e^x\text{,}\) its tangent line \(T_1(x)=1+x\text{,}\) and the quadratic approximation \(T_2(x) = 1 + x + \frac{1}{2}x^2\) near the point \((0,f(0))\text{.}\)
What if we wanted a degree-\(4\) polynomial approximation to \(f(x) = e^x\) near \(a = 0\text{?}\) Based on the patterns you’ve observed in \(T_1\text{,}\)\(T_2\text{,}\) and \(T_3\text{,}\) conjecture values for the constants \(d_0, \ldots, d_4\) for a function \(T_4\) of the form
that satisfies \(T_4(0) = f(0)\text{,}\)\(T_4'(0) = f'(0)\text{,}\)\(\ldots\text{,}\)\(T_4^{(4)}(0) = f^{(4)}(0)\text{.}\) Add this function \(T_4\) to your plot in part (c) that includes \(f(x)\) and the lower-degree polynomial approximations. What do you notice?
Subsection8.1.4As the degree of the approximation increases
Our work so far with the case study function \(f(x) = e^x\) suggests that as we find degree \(n\) polynomial approximations, \(T_n\text{,}\) that satisfy
In the next activity, we introduce the idea of the error of a polynomial approximation and investigate explicitly how the error varies for approximations of \(f(x) = e^x\) as we vary \(n\) and vary \(x\text{.}\)
We continue to work with \(f(x)=e^x\) and the four approximations of degree \(1\text{,}\)\(2\text{,}\)\(3\text{,}\) and \(4\) given by \(T_1(x)\text{,}\)\(T_2(x)\text{,}\)\(T_3(x)\text{,}\) and \(T_4(x)\text{.}\)
In Preview Activity 8.1.1, we built a spreadsheet that computed the differences between \(f(x)\) and \(T_1(x)\) for \(x\)-values between \(-1\) and \(1\text{,}\) spaced \(0.1\) units apart. Your spreadsheet started like the one shown in the table in Preview Activity 8.1.1.
Next, we build an updated version of this spreadsheet that computes similar differences between \(f\) and the three higher degree approximations we have found. In particular, we now want to have columns for \(\Delta x\text{,}\)\(x\text{,}\)\(f(x)\text{,}\)\(T_1(x)\text{,}\)\(T_2(x)\text{,}\)\(T_3(x)\text{,}\) and \(T_4(x)\text{,}\) plus the absolute differences \(|f(x) - T_1(x)|\text{,}\)\(|f(x) - T_2(x)|\text{,}\)\(|f(x) - T_3(x)|\text{,}\) and \(|f(x) - T_4(x)|\text{.}\)Hint: when building your entries, note that you can think of \(T_2(x)\) as \(T_2(x) = T_1(x) + \frac{1}{2}x^2\text{,}\) and similarly view \(T_3(x)\) as “\(T_2(x)\) plus one more term”.
Table8.1.10.The absolute error between \(f(x) = e^x\) and its degree \(1\text{,}\)\(2\text{,}\)\(3\text{,}\) and \(4\) approximations at \(x=-1\) and \(x=-0.9\text{.}\)
We call the value of \(|f(x) - T_2(x)|\) the absolute error of the quadratic approximation of \(f\) at the value \(x\). What is the absolute error of the quadratic approximation at \(x = -1\text{?}\) at \(x = 1\text{?}\)
Study your spreadsheet for trends that you notice as the value of \(x\) changes or the degree \(n\) of the approximation changes. What are your observations?
Investigate the errors in the various approximations for a wider interval of \(x\)-values. For example, you might consider starting at \(x = -2\) with \(\Delta x = 0.2\text{.}\) What do you notice?
One important application of our work so far is that these polynomial approximations provide a way to approximate values of the function \(f(x) = e^x\text{.}\) For example, since we’ve shown that
In fact, this approach through polynomial approximation is one way that computers determine the value of \(e^{\frac{1}{2}}\text{,}\) which is approximately \(1.64872127\text{,}\) to whatever accuracy is needed: by using even better polynomial approximations than the degree-\(4\) one that we found, computers are able to generate the approximate value \(1.64872127\) simply by the basic computations of addition and multiplication with enough terms.
Throughout this section, we have focused on \(f(x) = e^x\text{.}\) One of the characteristics that makes \(f(x) = e^x\) special is the fact that its derivative is itself; indeed, the \(n^{\text{th}}\) derivative of \(f\) is \(f^{(n)}(x) = e^x\) for every natural number \(n\text{,}\) which in turn implies that \(f^{(n)}(0) = 1\) for every value of \(n\text{.}\) This will ultimately help to find patterns in the coefficients of the degree \(n\) polynomial approximation, \(T_n(x)\text{,}\) and be able to easily write down a formula for any value of \(n\text{.}\)
It is natural to think that we can find similar approximations of other functions, especially ones such as \(\sin(x)\) and \(\cos(x)\) that also exhibit repeating patterns in their derivatives. In Section 8.2, we will develop a general approach to finding the coefficient of \(x^n\) in the degree \(n\) approximation of any function with \(n\) derivatives and learn how to find a general expression for the degree \(n\) approximation.
For the function \(f(x) = e^x\text{,}\) which bends considerably as we move away from \(a = 0\) (especially for \(x \gt 0\)), the tangent line, \(T_1(x)\text{,}\) is not a very good approximation for \(x\)-values that satisfy \(|x| \gt 0.5\text{.}\) For example, \(|e^{0.5} - T_1(0.5)| \approx 0.148721\text{,}\) so the linear approximation has an absolute error of more than \(0.1\) at \(x = 0.5\text{.}\)
Using the strategy of finding a higher degree polynomial whose function and derivative values match at the selected point of tangency, we are able to find higher degree polynomials that much more effectively approximate \(f(x) = e^x\) near \(a = 0\) than the approximation generated by the tangent line. For example, using the degree \(3\) approximation \(T_3(x) = 1 + x + \frac{1}{2}x^2 + \frac{1}{6}x^3\text{,}\) we see that \(|f(x) - T_3(x)| \lt 0.01\) for all \(x\) that satisfy \(|x| \lt 0.6\text{.}\)
It appears that the degree of the polynomial impacts the accuracy of the approximation of \(f(x) = e^x\) in at least two ways: if we fix an \(x\)-value, the higher the degree of the polynomial, the more accurate the approximation. In addition, raising the degree of the polynomial approximation appears to widen the interval on which the approximation is effective.
Let \(f(x)=\cos(x)\) and let \(T_2(x)=b_0+b_1x+b_2x^2\text{.}\) We find the values of \(b_0, b_1\) and \(b_2\) that make the functions \(\cos(x)\) and \(T_2(x)\) have the same height, slope, and concavity at \(x=0\text{.}\)
Let \(f(x)=\ln(1+x)\) and let \(T_2(x)=b_0+b_1x+b_2x^2\text{.}\) We find the values of \(b_0, b_1\) and \(b_2\) that make the functions \(\ln(1+x)\) and \(T_2(x)\) have the same height, slope, and concavity at \(x=0\text{.}\)
Let \(f(x)=e^{-2x}\) and let \(T_3(x)=c_0+c_1x+c_2x^2+c_3x^3\text{.}\) We find the values of \(c_0,\ldots,c_3\) that make the functions \(e^{-2x}\) and \(T_3(x)\) have the same height, slope, concavity, and third derivative value at \(x=0\text{.}\)
Let \(f(x)={3x^{2}+x+5}\) and let \(T_2(x)=b_0+b_1x+b_2x^2\text{.}\) We find the values of \(b_0, b_1\) and \(b_2\) that make the functions \(f(x)\) and \(T_2(x)\) have the same height, slope, and concavity at \(x=0\text{.}\)
In the following problem, note that “second degree Taylor polynomial” is the same as the quadratic approximation we’ve been studying, and we’ll see this terminology again in the following section.
Suppose that \(T_2(x)=c_0+c_1x+c_2x^2\) is the second degree Taylor polynomial for the function \(f\) about \(x=0\text{.}\) What can you say about the signs of \(c_0\text{,}\)\(c_1\text{,}\)\(c_2\) if \(f\) has the graph given below?
(For each, enter \(+\) if the term is positive, and \(-\) if it is negative. Note that because this is essentially multiple choice problem it will not show which parts of your answer are correct or incorrect.)
Throughout our work in Section 8.1, we have focused on approximating the function \(f(x) = e^x\text{.}\) In this exercise, we change the function of interest to \(f(x) = \frac{1}{3}x^3 + \frac{1}{4}x^2 - 2x - 1\text{,}\) and consider the linear and quadratic approximations to \(f\) near \(a = 0\text{.}\)
Use your work so far to determine the formula for \(T_1(x)\text{,}\) the tangent line approximation to \(f(x)\) at \(a =0\) (which satisfies \(T_1(0) = f(0)\) and \(T_1'(0) = f'(0)\)).
Let \(T_2(x)\) be the quadratic approximation to \(f(x)\) near \(a = 0\) that satisfies \(T_2(0) = f(0)\text{,}\)\(T_2'(0) = f'(0)\text{,}\) and \(T_2''(0) = f''(0)\text{.}\) You might start by letting \(T_2(x) = c_0 + c_1 x + c_2 x^2\text{,}\) and creating an updated table like the one shown below.
Use your work in in the table above to find the formula for \(T_2(x)\) that satisfies \(T_2(0) = f(0)\text{,}\)\(T_2'(0) = f'(0)\text{,}\) and \(T_2''(0) = f''(0)\text{.}\)
In this exercise, we extend our work in Exercise 8.1.6.6. We continue to consider the function \(f(x) = \frac{1}{3}x^3 + \frac{1}{4}x^2 - 2x - 1\text{,}\) but now build the cubic (degree \(3\)) approximation to \(f\) near \(a = 0\text{.}\)
Let \(T_3(x) = k_0 + k_1x + k_2x^2 + k_3x^3\) and determine \(T_3'(x)\text{,}\)\(T_3''(x)\text{,}\) and \(T_3'''(x)\text{.}\) In addition, determine \(f'''(x)\text{.}\) Record your results below, along with the values of each of these functions at \(a = 0\text{.}\)
Use your work in above to find the formula for \(T_3(x)\) that satisfies \(T_3(0) = f(0)\text{,}\)\(T_3'(0) = f'(0)\text{,}\)\(T_3''(0) = f''(0)\text{,}\) and \(T_3'''(0) = f'''(0)\text{.}\)