Skip to main content
Contents Index
Search Book
close
Search Results:
No results.
Calc Dark Mode Prev Up Next Scratch ActiveCode Profile
title here \(\require{cancel}\newcommand\degree[0]{^{\circ}}
\newcommand\Ccancel[2][black]{\renewcommand\CancelColor{\color{#1}}\cancel{#2}}
\newcommand{\alert}[1]{\boldsymbol{\color{magenta}{#1}}}
\newcommand{\blert}[1]{\boldsymbol{\color{blue}{#1}}}
\newcommand{\bluetext}[1]{\color{blue}{#1}}
\delimitershortfall-1sp
\newcommand\abs[1]{\left|#1\right|}
\newcommand{\lt}{<}
\newcommand{\gt}{>}
\newcommand{\amp}{&}
\newcommand{\fillinmath}[1]{\mathchoice{\boxed{\displaystyle \phantom{\,#1\,}}}{\boxed{\textstyle \phantom{\,#1\,}}}{\boxed{\scriptstyle \phantom{\,#1\,}}}{\boxed{\scriptscriptstyle\phantom{\,#1\,}}}}
\)
Section B.5 Regression
Figure B.5.1. GeoGebra calculator ABC keyboard
Subsection B.5.1 Making a Scatterplot and Finding the Regression Line
We use GeoGebra’s FitLine command to produce a regression line.
Example B.5.2 .
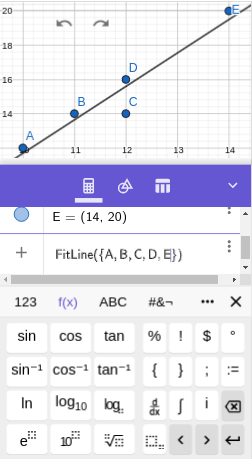
Make a scatterplot for the points
\((10,12)\text{,}\) \((11,14)\text{,}\) \((12,14)\text{,}\) \((12,16)\text{,}\) \((14,20)\text{.}\) Then find the equation of the lease-squares regression line and plot it on top of the scatterplot.
We enter each of the five ordered pairs. The output history will show each labeled with a capital letter, such as
\(A=(10,12)\text{.}\)
We do a Zoom to fit: right-click on the Graphics View (or click on the gear icon) and select Zoom to fit.
We next enter the FitLine command:
\begin{equation*}
\text{fitline}(\{A,B,C,D,E\})
\end{equation*}
using the ABC keyboard shown above for the letters, the 123 keyboard (
keyboard image ) for the parentheses, and the f(x) keyboard (
keyboard image ) for the list curly braces {}.
Important: We must enter capital letters for the names of the points--GeoGebra is case-sensitive regarding labels.
You have attempted
of
activities on this page.