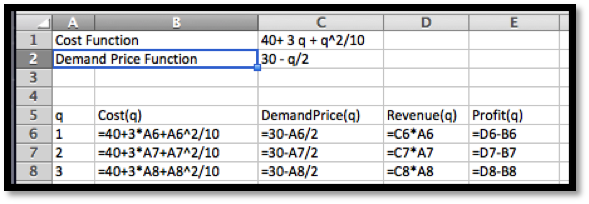
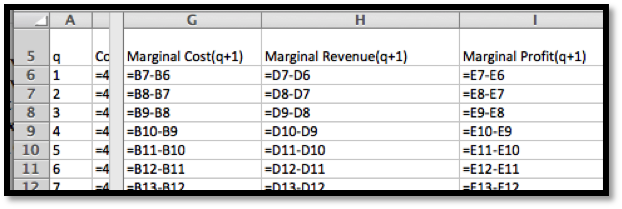
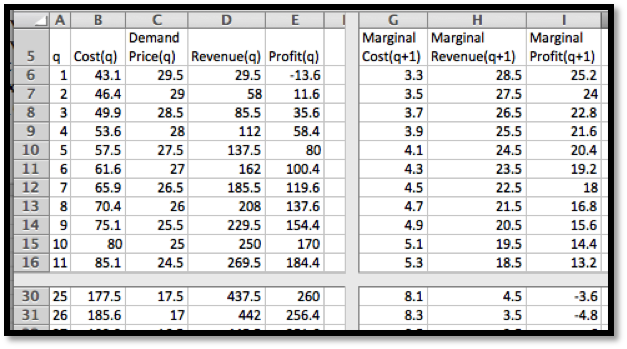
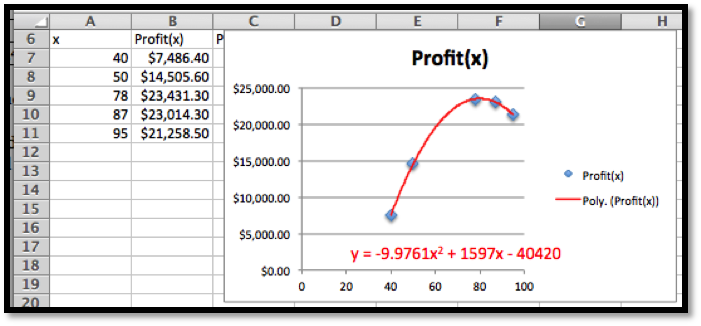
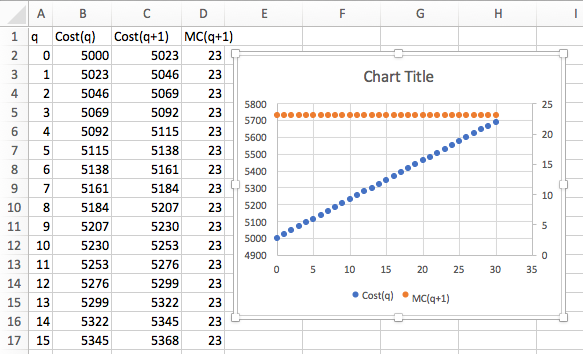
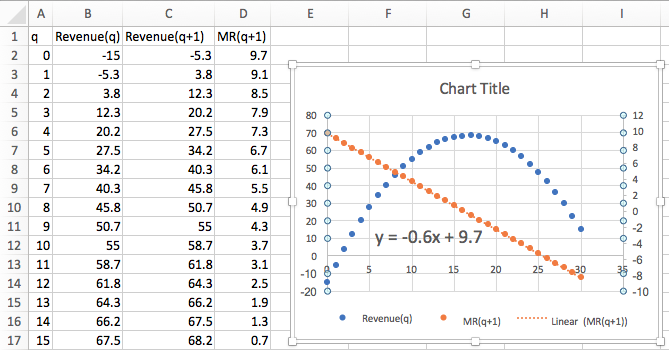
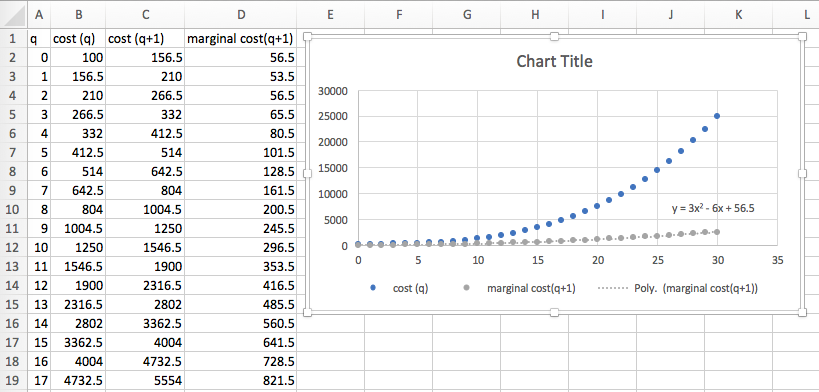
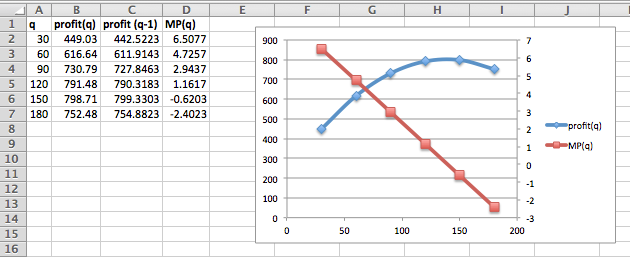
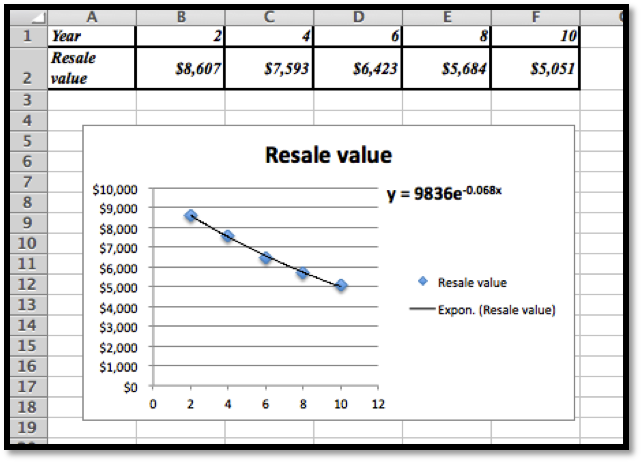
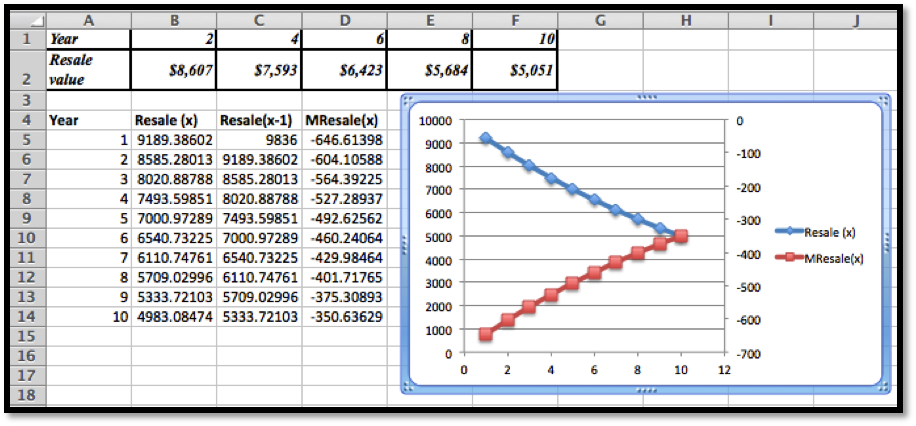
I put the data into a spreadsheet and find a best fitting curve to produce a formula. Looking at the data, I will assume that profit is a quadratic function of the amount produced.
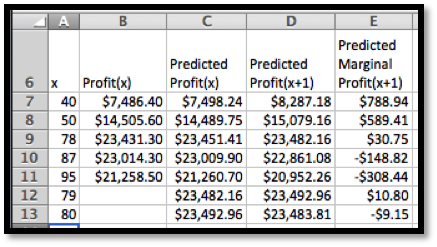
With the formula from the trendline, I can add a column for
\(\Pprofit(x)\text{.}\) The obvious adjustment produces
\(\Pprofit(x+1)\text{.}\) It is then easy to compute the value of
\(\Mprofit(x+1)\text{.}\)
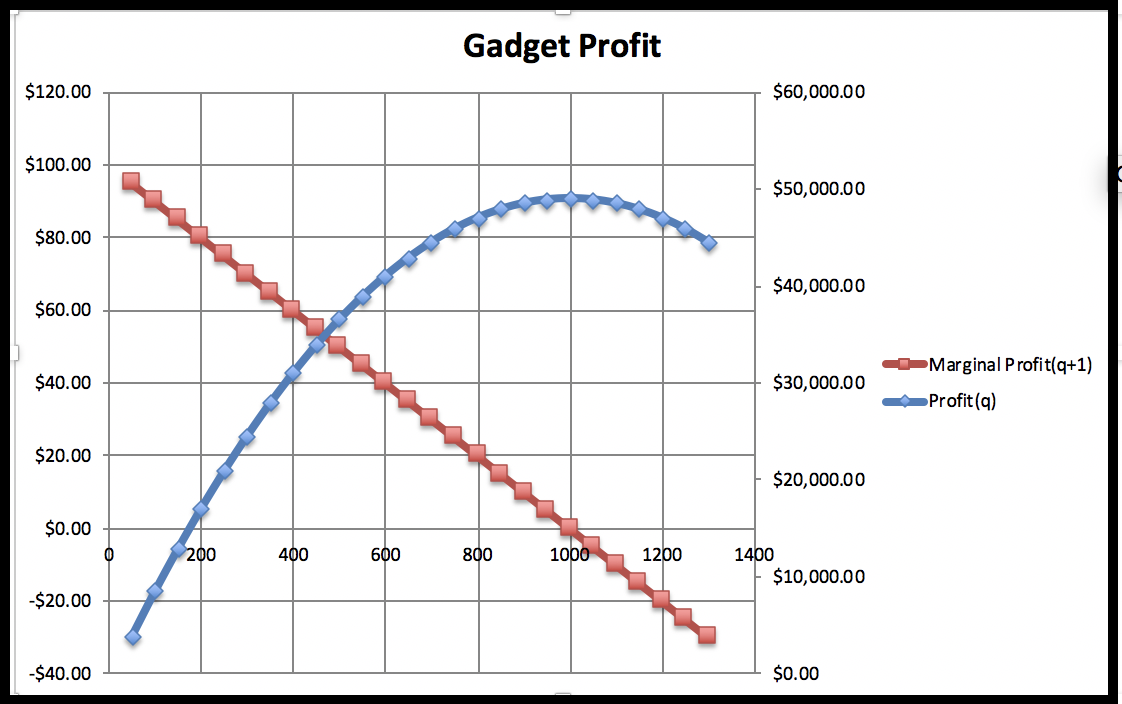
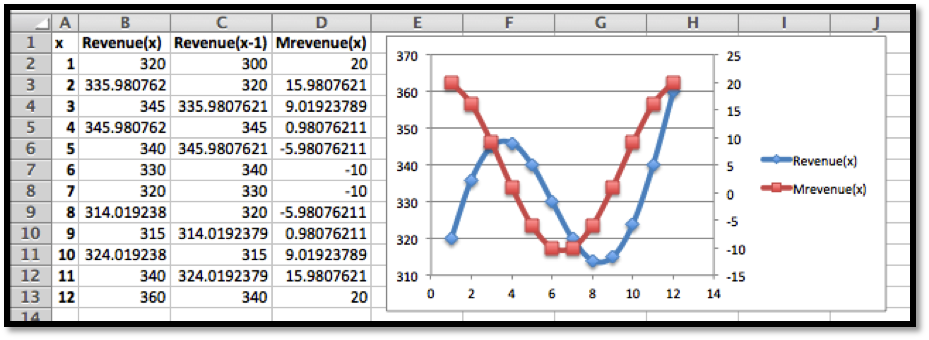
Looking at the graph, the maximum is close to
\(x=80\text{.}\) I simply add some rows with appropriate values of
\(x\) to get the desired answer.
When
\(x = 80\text{,}\) the Marginal Profit turns negative. The maximum profit is $23,492.96, obtained by producing 80 widgets.
