Subsection Section Preview
Investigate!
Mapmakers in the fictional land of Euleria have drawn the borders of the various dukedoms of the land. To make the map pretty, they wish to color each region. Adjacent regions must be colored differently, but it is perfectly fine to color two distant regions with the same color. What is the fewest colors the mapmakers can use and still accomplish this task?
Perhaps the most famous graph theory problem is how to color maps.
Given any map of countries, states, counties, etc., how many colors are needed to color each region on the map so that neighboring regions are colored differently?
Actual map makers usually use around seven colors. For one thing, they require watery regions to be a specific color, and with a lot of colors it is easier to find a permissible coloring. We want to know whether there is a smaller palette that will work for any map.
How is this related to graph theory? Well, if we place a vertex in the center of each region (say in the capital of each state) and then connect two vertices if their states share a border, we get a graph. Coloring regions on the map corresponds to coloring the vertices of the graph. Since neighboring regions cannot be colored the same, our graph cannot have vertices colored the same when those vertices are adjacent.
In general, given any graph
\(G\text{,}\) a coloring of the vertices is called (not surprisingly) a
vertex coloring. If the vertex coloring has the property that adjacent vertices are colored differently, then the coloring is called
proper. Every graph has a proper vertex coloring. For example, you could color every vertex with a different color. But often you can do better. The smallest number of colors needed to get a proper vertex coloring is called the
chromatic number of the graph, written
\(\chi(G)\text{.}\)
Our goal in this section is to see how graph coloring can be used to solve some problems and to understand some basic properties of graph coloring.
Worksheet Preview Activity
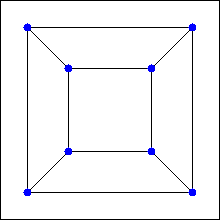
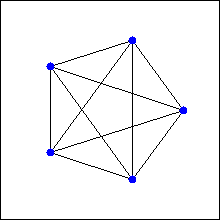
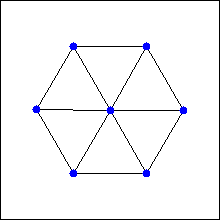
For each graph below:
-
Find a proper vertex coloring using some number of colors. That is, color vertices using any number of colors but in such a way that no pair of adjacent vertices have the same color.
-
Find the
fewest number of colors you need to properly color the vertices of the graph. This is called the
chromatic number of the graph. Think about how you know your answer is correct.
-
Can you generalize? Can you conclude anything about the chromatic number for particular sorts of graphs?
Subsection Coloring Vertices
Investigate!
The math department plans to offer 10 classes next semester. Some classes cannot run at the same time (perhaps they are taught by the same professor, or are required for seniors).
| Class: |
Conflicts with: |
| A |
D I |
| B |
D I J |
| C |
E F I |
| D |
A B F |
| E |
C H I |
| F |
C D I |
| G |
J |
| H |
E I J |
| I |
A B C E F H |
| J |
B G H |
How many different time slots are needed to teach these classes (and which should be taught at the same time)? More importantly, how could we use graph coloring to answer this question?
The best way to get a feel for the chromatic number is to actually try to color some graphs.
Example 2.5.1.
Find the chromatic number of the graphs below.
Solution.
The graph on the left is
\(K_6\text{.}\) The only way to properly color the graph is to give every vertex a different color (since every vertex is adjacent to every other vertex). Thus the chromatic number is 6.
The middle graph can be properly colored with just 3 colors (Red, Blue, and Green). For example:
There is no way to color it with just two colors, since there are three vertices mutually adjacent (i.e., a triangle). Thus the chromatic number is 3.
The graph on the right is just
\(K_{2,3}\text{.}\) As with all bipartite graphs, this graph has chromatic number 2: color the vertices on the top row red and the vertices on the bottom row blue.
It appears that there is no limit to how large chromatic numbers can get. It should not come as a surprise that
\(K_n\) has chromatic number
\(n\text{.}\) So how could there possibly be an answer to the original map coloring question? If the chromatic number of a graph can be arbitrarily large, then it seems like there would be no upper bound to the number of colors needed for any map. But there is.
The key observation is that while it is true that for any number
\(n\) there is a graph with chromatic number
\(n\text{,}\) only some graphs arrive as representations of maps. If you convert a map to a graph, the edges between vertices correspond to borders between the countries. So you should be able to connect vertices in such a way that the edges do not cross. In other words, the graphs representing maps are all
planar!
So the question is, what is the largest chromatic number of any planar graph? The answer is the best-known theorem of graph theory:
Theorem 2.5.2. The Four Color Theorem.
If
\(G\) is a planar graph, then the chromatic number of
\(G\) is less than or equal to 4. Thus any map can be properly colored with 4 or fewer colors.
We will not prove this theorem. Really. Even though the theorem is easy to state and understand, the proof is not. In fact, there is currently no “easy” known proof of the theorem. The current best proof still requires powerful computers to check an
unavoidable set of 633
reducible configurations. The idea is that every graph must contain one of these reducible configurations (this fact also needs to be checked by a computer) and that reducible configurations can, in fact, be colored in 4 or fewer colors.
Cartography is certainly not the only application of graph coloring. There are plenty of situations in which you might wish to partition the objects in question so that related objects are not in the same set. For example, you might wish to store chemicals safely. To avoid explosions, certain pairs of chemicals should not be stored in the same room. By coloring a graph (with vertices representing chemicals and edges representing potential negative interactions), you can determine the smallest number of rooms needed to store the chemicals.
Here is a further example:
Example 2.5.3.
Radio stations broadcast their signal at certain frequencies. However, there are a limited number of frequencies to choose from, so nationwide, many stations use the same frequency. This works because the stations are far enough apart that their signals will not interfere; no one radio could pick them up at the same time.
Suppose 10 new radio stations are to be set up in a currently unpopulated (by radio stations) region. The radio stations that are close enough to each other to cause interference are recorded in the table below. What is the fewest number of frequencies the stations could use?
|
KQEA |
KQEB |
KQEC |
KQED |
KQEE |
KQEF |
KQEG |
KQEH |
KQEI |
KQEJ |
| KQEA |
|
|
x |
|
|
x |
x |
|
|
x |
| KQEB |
|
|
x |
x |
|
|
|
|
|
|
| KQEC |
x |
x |
|
|
|
x |
x |
|
|
x |
| KQED |
|
x |
|
|
x |
x |
|
x |
|
|
| KQEE |
|
|
|
x |
|
|
|
|
x |
|
| KQEF |
x |
|
x |
x |
|
|
x |
|
|
x |
| KQEG |
x |
|
x |
|
|
x |
|
|
|
x |
| KQEH |
|
|
|
x |
|
|
|
|
x |
|
| KQEI |
|
|
|
|
x |
|
|
x |
|
x |
| KQEJ |
x |
|
x |
|
|
x |
x |
|
x |
|
Solution.
Represent the problem as a graph with vertices as the stations and edges when two stations are close enough to cause interference. We are looking for the chromatic number of the graph. Vertices that are colored identically represent stations that can have the same frequency.
This graph has chromatic number 5. A proper 5-coloring is shown on the right. Notice that the graph contains a copy of the complete graph
\(K_5\text{,}\) so no fewer than 5 colors can be used.
In the example above, the chromatic number was 5, but this is not a counterexample to the
Four Color Theorem 2.5.2, since the graph representing the radio stations is not planar. It would be nice to have some quick way to find the chromatic number of a (possibly non-planar) graph. It turns out nobody knows whether an efficient algorithm for computing chromatic numbers exists.
While we might not be able to find the exact chromatic number of a graph easily, we can often give a reasonable range for the chromatic number. In other words, we can give upper and lower bounds for the chromatic number.
This is not very difficult: for every graph
\(G\text{,}\) the chromatic number of
\(G\) is at least 1 and at most the number of vertices of
\(G\text{.}\)
What? You want
better bounds on the chromatic number? Well, you are in luck.
A
clique in a graph is a set of vertices all of which are pairwise adjacent. In other words, a clique of size
\(n\) is just a copy of the complete graph
\(K_n\text{.}\) We define the
clique number of a graph to be the largest
\(n\) for which the graph contains a clique of size
\(n\text{.}\) Any clique of size
\(n\) cannot be colored with fewer than
\(n\) colors, so we have a nice lower bound:
Theorem 2.5.4.
The chromatic number of a graph
\(G\) is at least the clique number of
\(G\text{.}\)
There are times when the chromatic number of
\(G\) is
equal to the clique number. These graphs have a special name; they are called
perfect. If you know that a graph is perfect, then finding the chromatic number is simply a matter of searching for the largest clique. However, not all graphs are perfect.
For an upper bound, we can improve on “the number of vertices” by looking at the degrees of vertices. Let
\(\Delta(G)\) be the largest degree of any vertex in the graph
\(G\text{.}\) One reasonable guess for an upper bound on the chromatic number is
\(\chi(G) \le \Delta(G) + 1\text{.}\) Why is this reasonable? Starting with any vertex, it together with all of its neighbors can always be colored in
\(\Delta(G) + 1\) colors, since at most we are talking about
\(\Delta(G) + 1\) vertices in this set. Now fan out! At any point, if you consider an already colored vertex, some of its neighbors might be colored, some might not. But no matter what, that vertex and its neighbors could all be colored distinctly, since there are at most
\(\Delta(G)\) neighbors, plus the one vertex being considered.
In fact, there are examples of graphs for which
\(\chi(G) = \Delta(G) + 1\text{.}\) For any
\(n\text{,}\) the complete graph
\(K_n\) has chromatic number
\(n\text{,}\) but
\(\Delta(K_n) = n-1\) (since every vertex is adjacent to every
other vertex). Additionally, any
odd cycle will have chromatic number 3, but the degree of every vertex in a cycle is 2. It turns out that these are the only two types of examples where we get equality, a result known as Brooks’ Theorem.
Theorem 2.5.5. Brooks’ Theorem.
Any graph
\(G\) satisfies
\(\chi(G) \le \Delta(G)\text{,}\) unless
\(G\) is a complete graph or an odd cycle, in which case
\(\chi(G) = \Delta(G) + 1\text{.}\)
The proof of this theorem is
just complicated enough that we will not present it here (although you are asked to prove a special case in the exercises). The adventurous reader is encouraged to find a book on graph theory to find suggestions for how to prove the theorem.
Subsection Coloring Edges
The chromatic number of a graph tells us about coloring vertices, but we could also ask about coloring edges. Just like with vertex coloring, we might insist that adjacent edges must be colored differently. Here, we are thinking of two edges as being adjacent if they are incident to the same vertex. The least number of colors required to properly color the edges of a graph
\(G\) is called the
chromatic index of
\(G\text{,}\) written
\(\chi'(G)\text{.}\)
Example 2.5.6.
Six friends decide to spend the afternoon playing chess. Everyone will play everyone else once. They have plenty of chess sets, but nobody wants to play more than one game at a time. Games will last an hour (thanks to their handy chess clocks). How many hours will the tournament last?
Solution.
Represent each player with a vertex and put an edge between two players if they play each other. In this case, we get the graph
\(K_6\text{:}\)
We must color the edges; each color represents a different hour. Since different edges incident to the same vertex will be colored differently, no player will be playing two different games (edges) at the same time. Thus we need to know the chromatic index of
\(K_6\text{.}\)
Notice that for sure
\(\chi'(K_6) \ge 5\text{,}\) since there is a vertex of degree 5. It turns out, 5 colors is enough (go find such a coloring). Therefore the friends will play for 5 hours.
Interestingly, if one of the friends in the above example left, the remaining 5 chessletes would still need 5 hours: the chromatic index of
\(K_5\) is also 5.
In general, what can we say about the chromatic index? Certainly
\(\chi'(G) \ge \Delta(G)\text{.}\) But how much higher could it be? Only a little higher.
Theorem 2.5.7. Vizing’s Theorem.
For any graph
\(G\text{,}\) the chromatic index
\(\chi'(G)\) is either
\(\Delta(G)\) or
\(\Delta(G) + 1\text{.}\)
At first, this theorem makes it seem like the chromatic index might not be very interesting. However, deciding which case a graph is in is not always easy. Graphs for which
\(\chi'(G) = \Delta(G)\) are called
class 1, while the others are called
class 2. Bipartite graphs always satisfy
\(\chi'(G) = \Delta(G)\text{,}\) so are class 1 (this was proved by König in 1916, decades before Vizing proved his theorem in 1964). In 1965 Vizing proved that all planar graphs with
\(\Delta(G) \ge 8\) are of class 1, but this does not hold for all planar graphs with
\(2 \le \Delta(G) \le 5\text{.}\) Vizing conjectured that all planar graphs with
\(\Delta(G) = 6\) or
\(\Delta(G) = 7\) are class 1; the
\(\Delta(G) = 7\) case was proved in 2001 by Sanders and Zhao; the
\(\Delta(G) = 6\) case is still open.
Ramsey Theory.
There is another interesting way we might consider coloring edges, quite different from what we have discussed so far. What if we colored every edge of a graph either red or blue? Can we do so without, say, creating a
monochromatic triangle (i.e., an all red or all blue triangle)? Certainly, for some graphs the answer is yes. Try doing so for
\(K_4\text{.}\) What about
\(K_5\text{?}\) \(K_6\text{?}\) How far can we go?
The problem above is not too difficult and is a fun exercise. We could extend the question in a variety of ways. What if we had three colors? What if we were trying to avoid other graphs? Surprisingly, very little is known about these questions. For example, we know that you need to go up to
\(K_{17}\) in order to force a monochromatic triangle using three colors, but nobody knows how big you need to go with more colors. Similarly, we know that using two colors,
\(K_{18}\) is the smallest graph that forces a monochromatic copy of
\(K_4\text{,}\) but the best we have to force a monochromatic
\(K_{5}\) is a range, somewhere from
\(K_{43}\) to
\(K_{49}\text{.}\) If you are interested in these sorts of questions, this area of graph theory is called Ramsey theory. Check it out.


