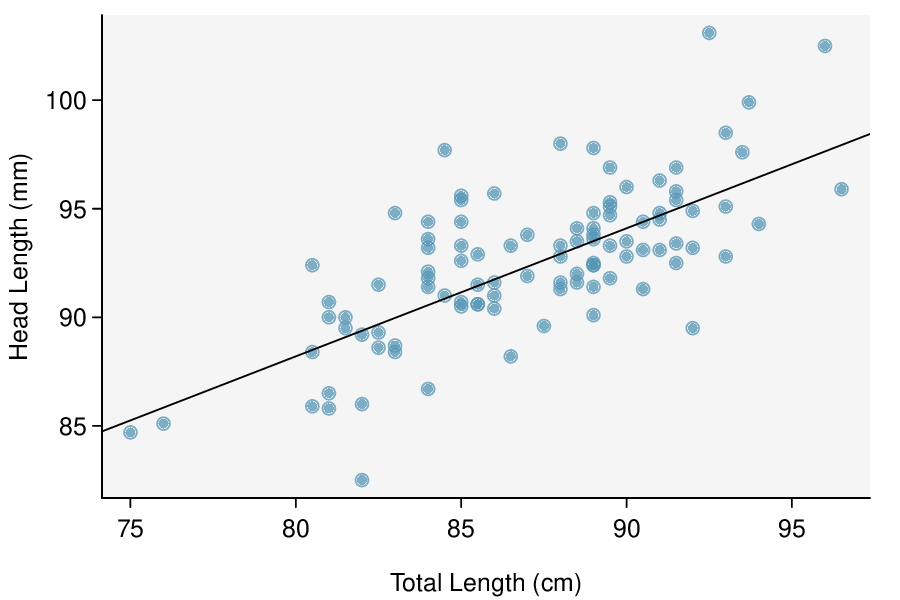
Identify: The parameter of interest is the slope of the population regression line for predicting head length from body length. We want to estimate this at the 95% confidence level.
Choose: Because the parameter to be estimated is the slope of a regression line, we will use the
-interval for the slope.
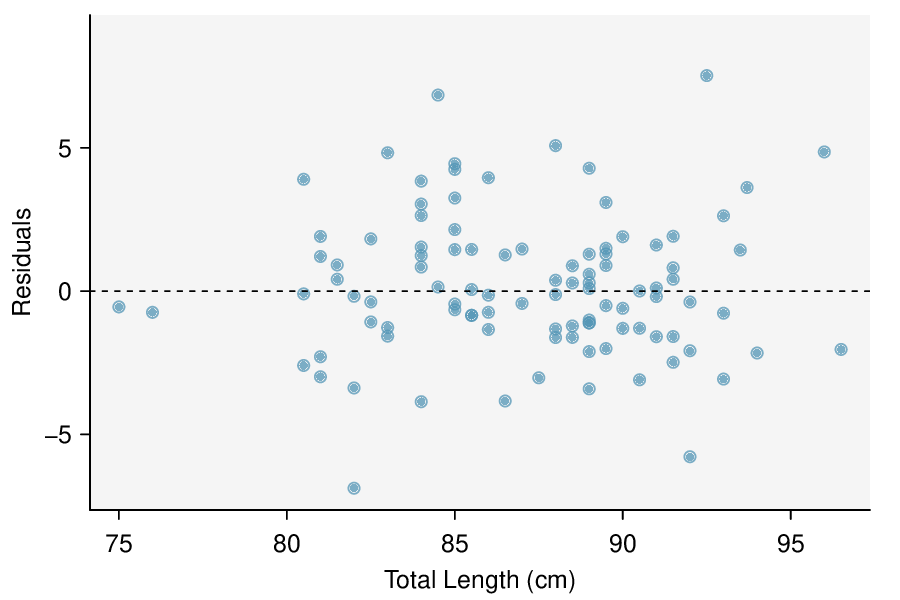
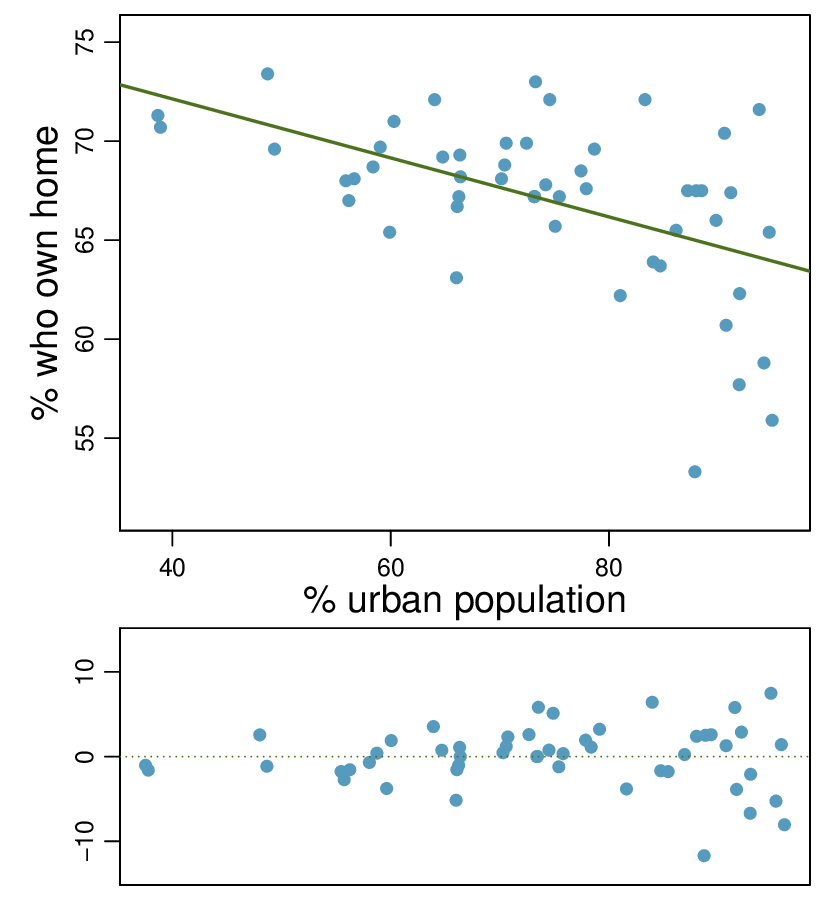
Check: These data come from a random sample. The residual plot shows no pattern so a linear model seems reasonable. The residual plot also shows that the residuals have constant standard deviation. Finally,
so we do not have to check for skew in the residuals. All four conditions are met.
Calculate: We will calculate the interval:
We read the slope of the sample regression line and the corresponding
from the table. The point estimate is
The
of the slope is 0.05933, which can be found next to the slope of 0.57290. The degrees of freedom is
As before, we find the critical value
using a
-table (the
value is not the same as the
-statistic for the hypothesis test). Using the
-table at row
(round down since 102 is not on the table) and confidence level 95%, we get
So the 95% confidence interval is given by:
Conclude: We are 95% confident that the slope of the population regression line is between 0.456 and 0.691. That is, we are 95% confident that the true average
increase in head length for each additional cm in total length is between 0.456mm and 0.691mm. Because the interval is entirely above 0, we do have evidence of a positive linear association between the head length and body length for brushtail possums.

