We have previously verified that the binomial model is reasonable for this context. Now we will verify that both and are at least 10 so we can apply the normal approximation to the binomial model:
With these conditions checked, we may use the normal approximation in place of the binomial distribution with the following mean and standard deviation:
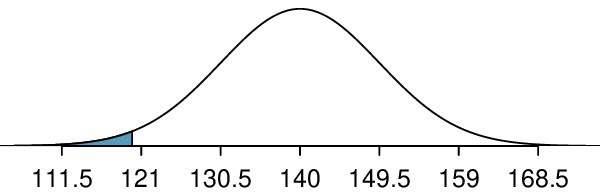
We want to find the probability of observing fewer than 120 with blood type O+ using this model. We note that 120 is just over 2 standard deviations below the mean:
Next, we compute the Z-score as
to find the shaded area in the picture:
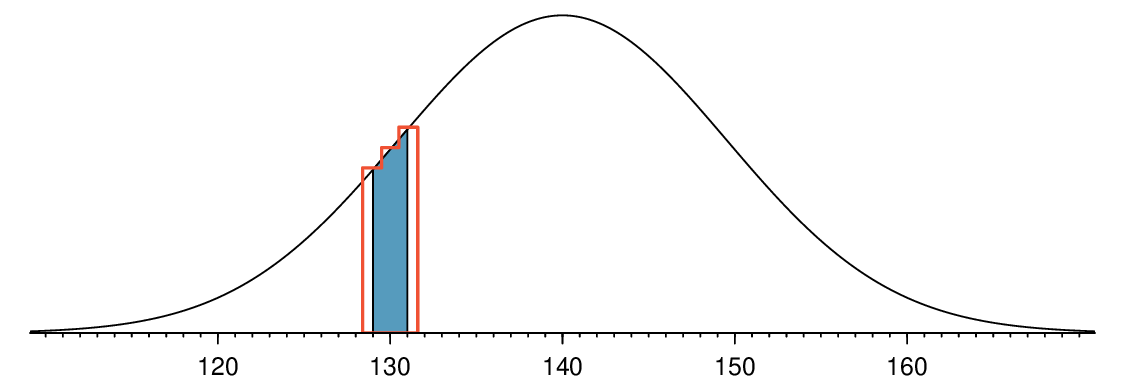
This probability of 0.0179 using the normal approximation is very close to the true probability of 0.0196 from the binomial distribution.