Measures of Center
Some of the most widely used statistics are “measures of center,” which describe where the data is centered. This type of statistic is extremely useful, as it allows you to summarize all the data with one number/category. Statistics that summarize key aspects of the data are called summary statistics.
You can think of a measure of center as a “best guess”. If you had one guess at the value of a new observation (e.g. the height of a new student who joins the class), what would you guess?
The Three Measures of Center
The mean is the standard form of averaging.
The mean is calculated by adding up all the values in the data, and dividing by the number of data points.
The mean is only defined for quantitative variables.
Sometimes the mean is referred to simply as the “average” (for example in Sheets), but it is better to remember it as the mean.
The median is the middle value.
If you order all the data points from lowest to highest, the median is the value that sits directly in the middle.
If there are two “middle values” (which occurs when there is an even number of data points), the median is halfway between the two values.
The median is only defined for quantitative variables.
The median is the value such that half the values are below it, and half the values are above it.
The mode is the most commonly occurring value in the data.
If you count the number of times each category occurs, the mode is the category with the highest count.
Sometimes the mode is referred to simply as the most common value.
A dataset can have multiple modes - if multiple categories have the same count, and this count is higher than those of the other categories.
The mode is only defined for categorical variables.
When handling different types of data, some measures of center can tell you more useful information than others can. Whenever you have a categorical variable, the mode is your only choice for a measure of center. However, with quantitative variables, either the mean or median can be used to describe the “best guess”. You can begin building intuition about which of the three measures of center is most appropriate through some examples.
Mean
-
Incorrect: What kind of variable is birth country?
Median
-
Incorrect: What kind of variable is birth country?
Mode
-
Correct
Q-1: You have a dataset on the birth country of all of your students. A new student joins your class, and you want to take a “best guess” at where she comes from. What measure of center would you use?

Q-2: You want to do a study on whether it is more expensive to rent an apartment in Seattle or in New York City. What data would you collect to answer this question, and what summary statistics could be useful?
The mean, median, and mode functions in Sheets all have the exact same syntax as
the MIN and MAX functions, defined earlier
here. You can either input all relevant
values into the function separated by commas, or you can define a cell range.
The latter is far more convenient in most cases.
Measures of Center in Sheets
The AVERAGE function returns the mean of a set of values. You can either
input several values separated by a comma (e.g.
=AVERAGE(value1, value2, value3)), or you can input a range of cells of
which you want to know the mean (e.g. =AVERAGE(A1:A10)).
Note that mean is called AVERAGE in Sheets. It is nevertheless recommended to use the term “mean” to describe this measure of center wherever possible (e.g. in reports and articles), to disambiguate different measures of center. See here for a longer discussion.
The MEDIAN function returns the median of a set of values. You can either
input several values separated by a comma (e.g.
=MEDIAN(value1, value2, value3)), or you can input a range of cells of
which you want to know the median (e.g. =MEDIAN(A1:A10)).
The MODE function returns the mode of a set of values. You can either
input several values separated by a comma (e.g.
=MODE(value1, value2, value3)), or you can input a range of cells of
which you want to know the mode (e.g. =MODE(A1:A10)).
Example: Test Scores
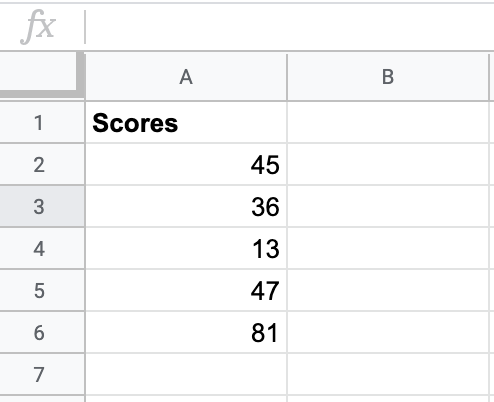
Say you are helping grade for a class and your professor has given you a list of student scores for the last exam. How would you calculate the median and mode in sheets?

Now that you have some practice with creating formulas to calculate median and mean, you can start to build some intuition as to what the differences between these measures of center may be. Say someone asked you for your advice about where they wanted to move after graduation, and that the weather was a major concern for them. You want to give them a summary statistic to accurately summarize what the weather might be like at those respective locations. Would the mean or median make more sense? The next example can help you understand when you would want to use the mean versus the median.
Example: Weather
First, calculate and compare the mean maximum daily temperature in Seattle and New York City (NYC). The data for the two cities’ temperatures are in two different sheets.
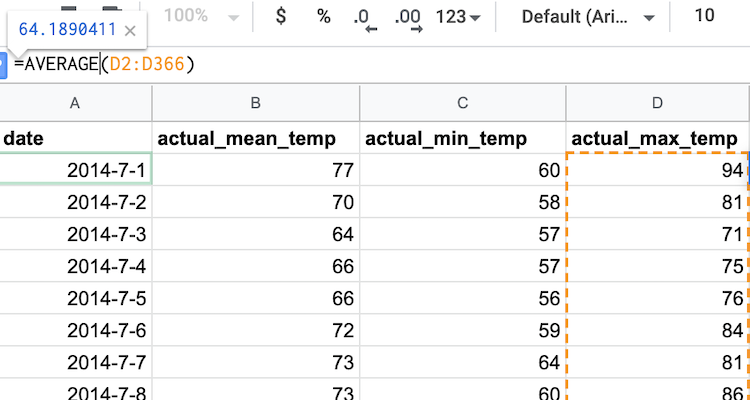
The “actual_max_temp” is in column D, and tells you the maximum daily
temperature. Calculating the mean of that is as simple as using the AVERAGE
function on that cell range as shown in the image below. From this, you can see
that the mean maximum temperature in Seattle is 64.2 degrees.

You can now switch to the NYC sheet and use the exact same formula.
This example indicates that on average, over the course of twelve months, Seattle and NYC have fairly similar temperatures. Does this seem right to you?
In reality, for a given time of year, the temperatures of Seattle and NYC usually differ significantly. NYC winters are considerably colder than Seattle winters, and NYC summers tend to be warmer than Seattle summers. When averaged over twelve months, however, these effects “cancelled out”, and, when looking just at the mean, it may look as if Seattle and NYC have similar temperatures all year round.
Sometimes summary statistics can over-summarize the data. You will learn more about how to take this over-summarization into account in the section below on measures of spread. In the meantime, you can look closer into investigating the median of this data.
Q-6: Calculate the median maximum temperatures for Seattle and NYC. Do these statistics tell a different story? Why?
Right now, the mean and median may not seem all that different. However, there are cases where the median is more useful than the mean. The next section on outliers will explain this difference through an example on family income.